FX Carry (Hardened v2)
Cross-sectional G8 interest-rate carry
Lost money over a full 15-year sample; the rate-ranked signal was beaten by 33% of random sign-permutations. v1's PF 1.17 was a 2023–26 subsample artifact. Carry retired.
- Category
- Carry
- Window
- 2011–2026 (15.4y, 796 weekly rebalances)
- Instruments
- G8 FX majors (real Dukascopy daily + real USDCHF)
- Timeframe
- Weekly rebalance
- Tested
- 2026-06-21
The story in one line
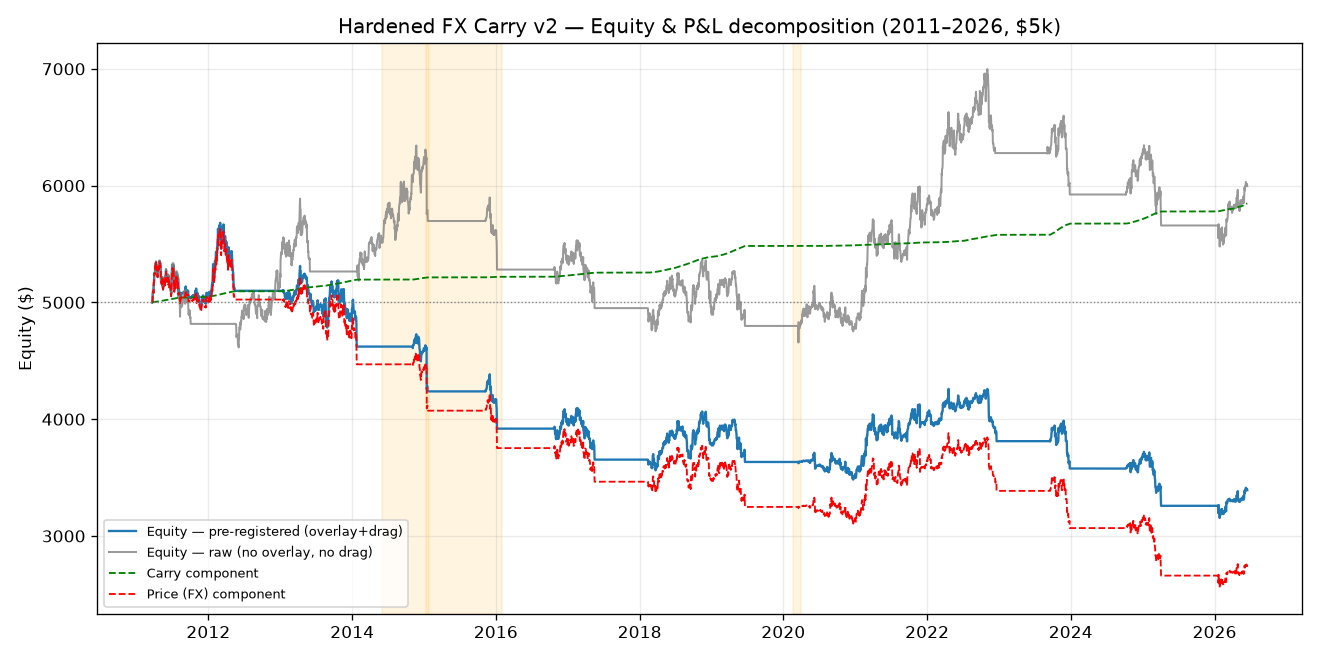
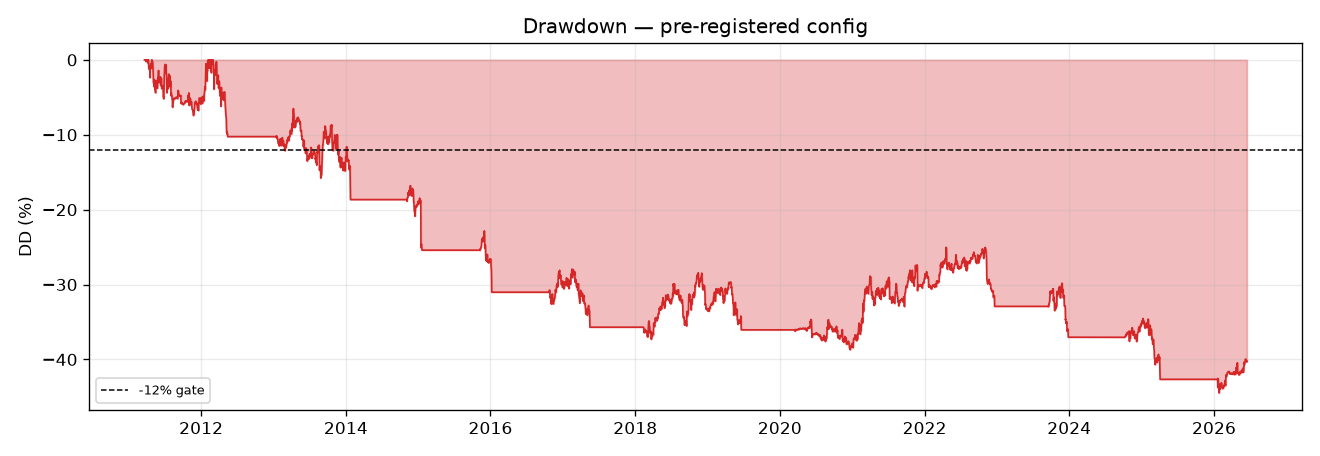
Run exactly as pre-registered over a full 15-year sample, hardened cross-sectional FX carry loses money: final $3,392 (−32%), CAGR −2.5%, profit factor 0.844, Sharpe −0.29, max drawdown −44.5%. It passes 3 of 11 gates — and all three are trivial (≥100 weeks; low concentration, which here only means it loses broadly). All eight substantive gates fail.
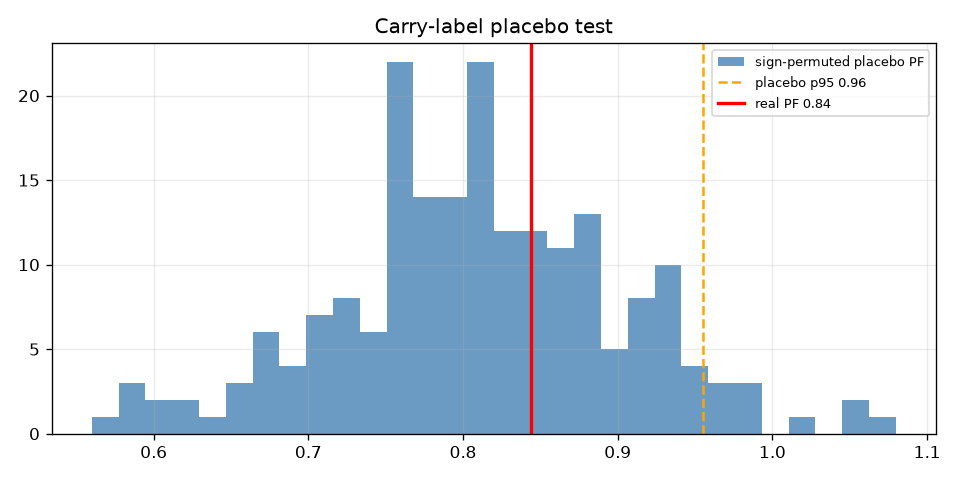
The decisive result is the carry-label placebo: the real strategy (PF 0.844) is beaten by 33% of random sign-permutations and sits below the placebo 95th percentile (0.955). Over 2011–2026, ranking currencies by interest rate was worse than random. The high-yielders depreciated more than they paid in carry — the forward-premium puzzle did not pay on G10 majors in this era.
Per the frozen multi-testing rule, v2 failed → no v3. Carry is retired — the 6th archetype to fail honestly.
Gate scorecard — 3 / 11
| # | Gate | Result | Pass |
|---|---|---|---|
| 1 | ≥ 100 weekly rebalances | 796 | ✅ |
| 2 | PF ≥ 1.20 net | 0.844 | ❌ |
| 3 | Annualized Sharpe ≥ 0.6 | −0.29 | ❌ |
| 4 | Max DD ≤ 12% | −44.5% | ❌ |
| 5 | Positive in ≥ 60% of years | 38% | ❌ |
| 6 | Block-bootstrap 95% LB Sharpe > 0 | −0.83 | ❌ |
| 7 | Carry-label placebo: real PF > p95 | 0.844 < 0.955 | ❌ |
| 8 | 2× cost stress: PF > 1.0 | 0.839 | ❌ |
| 9 | Deflated Sharpe positive | DSR 0.012 | ❌ |
| 10 | No currency > 40% of P/L | max 33% (CHF) | ✅ |
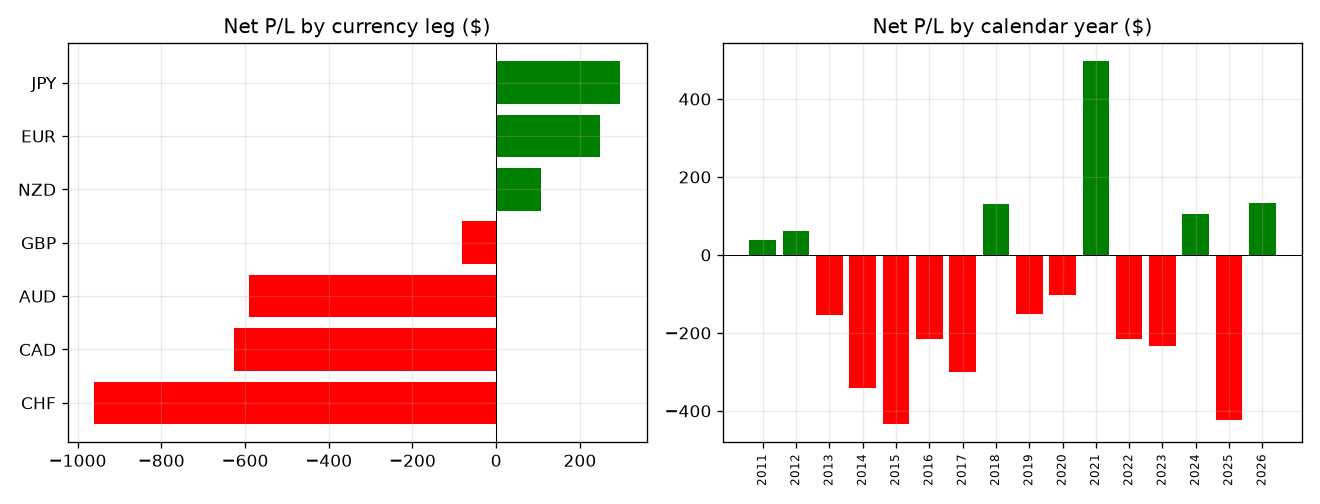
| 11 | No calendar year > 40% of P/L | max 14% | ✅ |
Gates evaluated on the base pre-registered config (overlay + 75 bp financing drag). No configuration was selected post-hoc to pass.
Why it fails — root cause
(a) The carry edge in G10 is real but tiny post-GFC, and FX drift dwarfs it. Decomposition: cumulative carry +$848, FX price −$2,261, costs −$195. The interest differential earned a slow trickle because 2011–2021 was a near-universal ZIRP era — there was almost no carry to harvest — while the FX leg lost 4× what carry earned. This matches the well-documented “lost decade” for G10 carry.
(b) The signal underperforms random. 33% of random currency-sign assignments beat the real rate-ranked strategy. Whatever P/L exists is not attributable to the carry signal.
(c) The crashes are real and concentrated in the FX leg. CHF −$961 (short-CHF blew up at the Jan-2015 SNB de-peg — USDCHF gapped ~−15% intraday); CAD −$626 and AUD −$591 (long high-yielders through the 2014–15 USD super-cycle). These are the canonical carry-crash mechanism.
(d) The risk overlay made it worse. Raw (no overlay) finishes $5,996 (PF 1.068); pre-registered (overlay + drag) finishes $3,392 (PF 0.844). The VIX de-gross and 12-month drawdown circuit are reactive — they cut exposure after drawdowns begin and stay de-grossed through recoveries, locking in losses. A reactive overlay cannot rescue a signal with no in-sample edge — it can only bleed it. This transferable lesson held in every test, including the 2008 GFC stress appendix (−17.0% with overlay vs −17.5% without).
Reconciling v1 (PF 1.17) with v2 (PF 0.844)
Not a contradiction — sample selection. 2023–2026 was a rare confluence: the largest G10 differentials in 15 years and no grinding carry crash. Measure a strategy on its best regime and it looks deployable; measure it across regimes and the truth surfaces. The two runs also used independent rate sources and v2 used real USDCHF — a genuine independent validation that overturns v1.
Honest caveats
Hand-coded policy rates (small errors can’t flip a placebo-below-random result), 2025–26 rates are a partial reconstruction affecting only the last ~10% of the sample, daily resolution (captures the 2015 CHF gap; intraday was worse). A broad EM carry basket — where the literature’s premia actually live — is a different archetype and instrument set, out of scope for a $5k retail MT5 account.
Verdict: FAIL (PF 0.844). Do not deploy. Not close. Carry is retired as a standalone deployable archetype. What it taught us — that reactive risk overlays destroyed value in every test — is kept as a project-wide lesson.
Charts & evidence
Frequently asked
Does the FX carry trade still work in 2026?
Not on G10/G8 majors for a small retail account. Run as pre-registered over a full 2011–2026 sample, hardened cross-sectional carry returned a net profit factor of 0.844 (below 1.0), a Sharpe of −0.29, and a −44.5% max drawdown. The interest differential earned a thin trickle while the FX/price leg bled roughly 4× as much. The academic carry premium lives largely in 1980s–2000s data and in broad EM baskets, not post-2008 G10.
Why did carry v1 show a profit factor of 1.17 but v2 show 0.844?
Sample selection. v1 measured only 2023–2026 — the largest G10 rate differentials in 15 years (Fed 5.4% vs BoJ −0.1%) with no grinding carry crash. Extended to the full 2011–2026 window with the real 2014–15 USD super-cycle, the 2015 CHF de-peg and COVID, the edge evaporated. This is exactly the failure that pre-registration plus a long sample is designed to catch.
Did the risk overlay help the carry strategy?
No — it made it worse. The raw signal (no overlay) finished at PF 1.068; adding the pre-registered VIX/drawdown de-gross overlay dropped it to PF 0.844. Reactive de-grossing cuts exposure after drawdowns begin and stays cut through the recovery, locking in losses. This held even in the 2008 GFC stress appendix.
Methodology: The Validation Gauntlet — pre-registered spec, 11-gate battery, real market data.
Full reproducible report: backtests/carry_hardened/REPORT.md in the source repository.
Author: Brent Akamine (Founder, Vinovest). Backtests are not investment advice.