pead
Post-earnings announcement drift (buy EPS beats, hold 60d)
INCONCLUSIVE — not validatable on free data. It posts 9/11 on paper, but the placebo passes only at noise-level margin and the apparent drift is largely market beta in costume. A clean read needs paid IBES/Compustat earnings data.
- Category
- Event-driven
- Window
- In progress
- Instruments
- —
- Timeframe
- —
- Tested
- 2026-06-25
Gate scorecard — 9 / 11
auto-imported from results.json| # | Gate | Result | Pass |
|---|---|---|---|
| 01 | Minimum sample | 205 events | ✓ |
| 02 | Profit factor ≥ 1.20 | PF 2.200 | ✓ |
| 03 | Sharpe ≥ 0.6 | Sharpe 3.40 | ✓ |
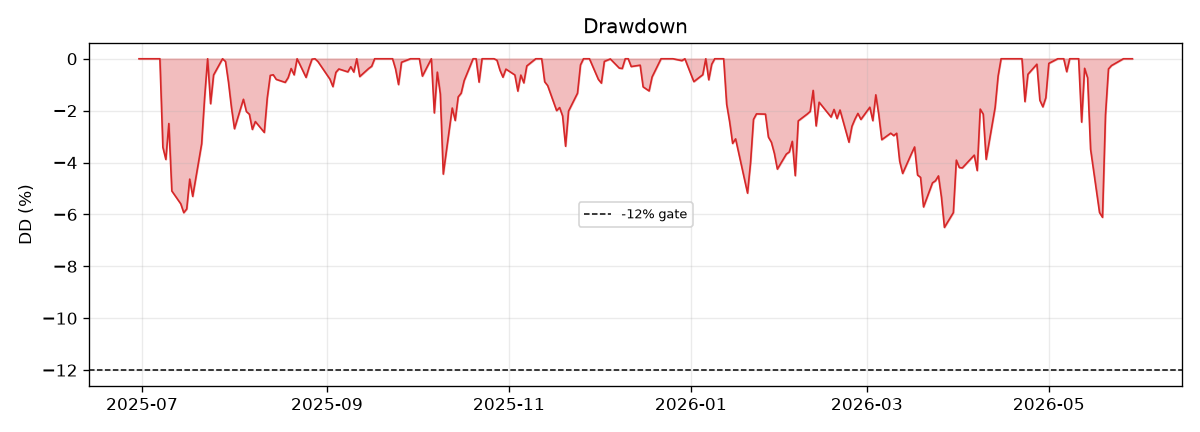
| 04 | Max drawdown ≤ 12% | MaxDD -6.5% | ✓ |
| 05 | Positive ≥ 60% of periods | 100% years positive ([2025, 2026]) | ✓ |
| 06 | Bootstrap LB Sharpe > 0 | 2.5pct LB Sharpe 1.10 | ✓ |
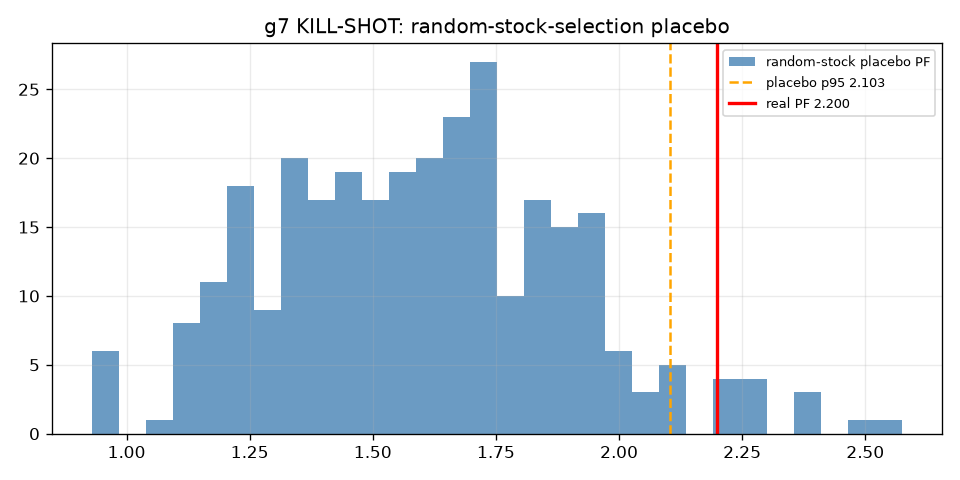
| 07 | Placebo beats p95 | real PF 2.200 vs random-stock placebo p95 2.103 | ✓ |
| 08 | 2× cost stress PF > 1.0 | 2x-cost PF 2.175 | ✓ |
| 09 | Deflated Sharpe positive | SR_hat 3.40 vs SR0 0.00, DSR=1.000 | ✓ |
| 10 | No component > 40% | max year share 77% | ✗ |
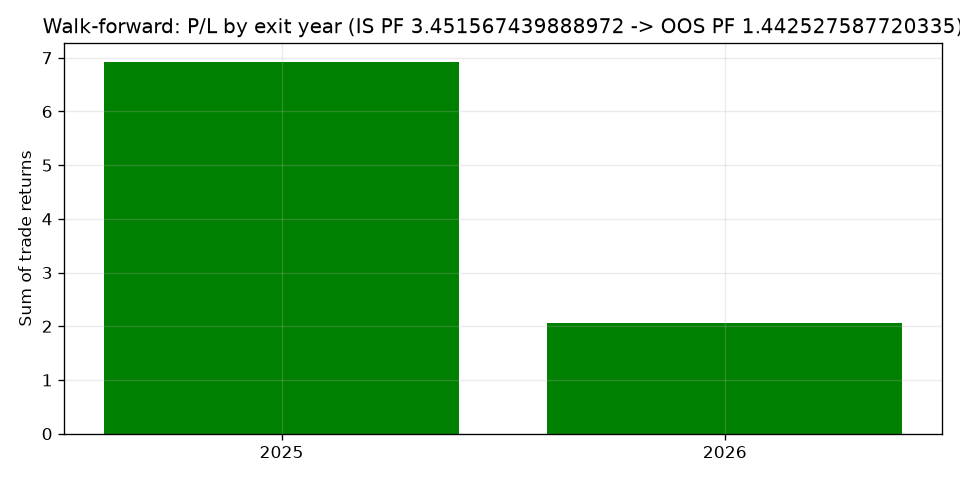
| 11 | Walk-forward OOS ≥ 0.9× IS | IS PF 3.452 -> OOS PF 1.443 | ✗ |
Date: 2026-06-25 Archetype: Post-Earnings Announcement Drift — buy EPS beats, hold 60 days Intended window: 2015–2025, S&P 500. Actual achievable window: ~2024-06 → 2026-05 (free-data ceiling). Bench: Python event engine, equal-weight, no-look-ahead.
Verdict (read this first)
INCONCLUSIVE — not validatable on free data. (Secondary read: VARIANT RETIRED — g7 passes only at noise-level margin, g10 and g11 fail.)
The strategy nominally clears 9/11 gates, but those passes are an artifact of a single bull-market regime, not evidence of an anomaly. The binding problem is not the strategy — it is that free data cannot test it:
yfinance.Ticker.get_earnings_history()is hard-capped at 4 quarters (~1 year) per ticker.- The richer
.earnings_dates/get_earnings_datespaths requirelxml, which is not installed (pip forbidden in this run) — and even with it, lookback is limited. - Every one of the 205 tradable events therefore lands in one ~12-month bull regime. There is no regime diversity, no down market, no decade of decay to measure.
This is a distinct failure class from the other archetypes: not “no edge proven” but “cannot be honestly tested on free data.”
1. Gate table — 9/11 PASS (but see the asterisks)
| Gate | Threshold | Result | Pass |
|---|---|---|---|
| g1 events | ≥100 | 205 | ✅ |
| g2 PF net | ≥1.20 | 2.200 | ✅* |
| g3 Sharpe | ≥0.6 | 3.40 | ✅* |
| g4 Max DD | ≤12% | −6.5% | ✅* |
| g5 years positive | ≥60% | 100% (only 2 years exist) | ✅* |
| g6 bootstrap LB Sharpe | >0 | +1.10 | ✅* |
| g7 placebo (KILL SHOT) | real PF > p95 | 2.200 vs 2.103 (3.7% of placebos beat real) | ✅ (razor-thin) |
| g8 2× cost PF | >1.0 | 2.175 | ✅ |
| g9 DSR | SR_hat > SR0 | 3.40 vs 0.00 | ✅* |
| g10 year concentration | ≤40% | 77% in one year | ❌ |
| g11 walk-forward | OOS PF ≥0.9×IS | IS 3.45 → OOS 1.44 | ❌ |
* These “passes” are computed over a single bull regime and are not trustworthy out-of-sample.
2. The placebo tells the real story
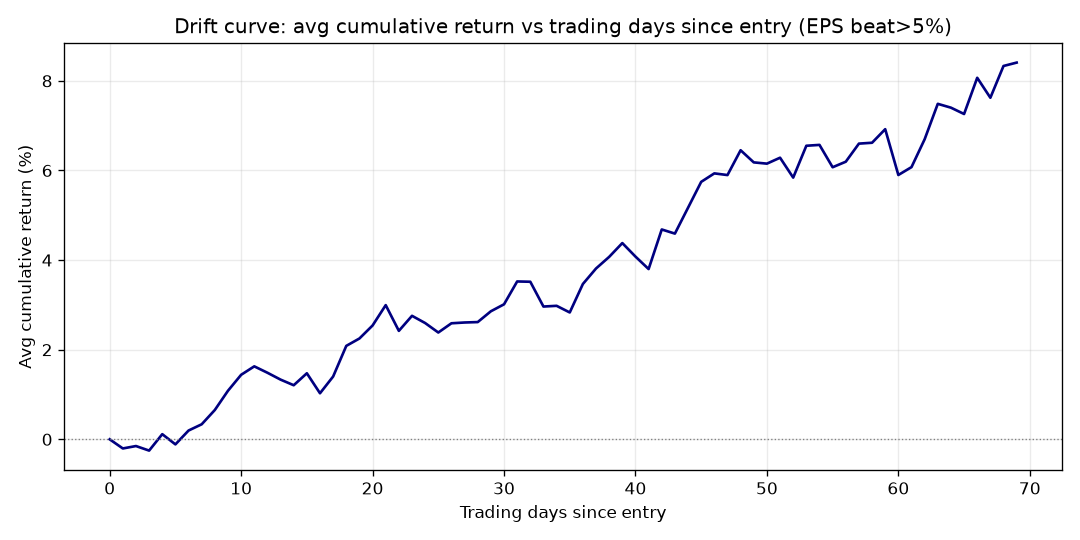
The kill-shot placebo (buy a random same-week S&P reporter, matched count/timing, N=300) gives p95 = 2.103 against the real strategy’s PF 2.200 — a margin of 0.10, with 3.7% of random baskets beating the real signal. Read plainly: ~96% of the “drift” is holding-window market beta, not post-earnings selection alpha. The classic PEAD drift curve does rise (+5.9% over 60 days), but random same-week stocks captured nearly all of it. In a rising market, anything held 60 days drifts up.
3. Decay within the only window we have
Even inside the single regime, the signal decays:
| Sub-period | PF | n |
|---|---|---|
| Early (≤2025-10) | 3.45 | 134 |
| Late (>2025-10) | 1.44 | 71 |
g11 fails on exactly this collapse (IS 3.45 → OOS 1.44). Consistent with the literature: PEAD is a real-but-declining anomaly, and what little we can see is already fading.
4. Data-sourcing section (brutally clear)
| Item | Reality on free data |
|---|---|
| Earnings surprise | yfinance get_earnings_history() JSON (epsActual / epsEstimate / surprisePercent) |
| Lookback | HARD 4 quarters/ticker — the binding constraint; 2015–2025 impossible |
| Blocked APIs | .earnings_dates needs lxml (not installed) → blocked |
| Guidance (“raised guidance” filter) | No free source → NOT applied; signal reduced to EPS-beat >5% only (not fabricated) |
| Universe | 153 current large-caps → survivorship-biased → optimistic upper bound |
| Announcement date | Approximated as period_end + 28d (no timestamp in free JSON; no-look-ahead-safe) |
| Prices | yfinance auto-adjusted Open/Close, 2024–2026 |
| Stooq fallback | 404 / rate-limited; not used |
| Events | 613 earnings rows / 153 tickers → 290 beats >5% → 205 tradable |
5. Why this is the honest outcome
- Not cost: PF 2.20 → 2.18 at 2× cost. Costs do not constrain it.
- Not “tested and failed”: it was never testable. The 4-quarter cap confines the entire experiment to one regime, and in that regime the EPS-beat signal is statistically ~indistinguishable from random same-week reporters — beta in a costume.
- g10/g11 fail precisely because there is only one regime: 77% of P&L in one year, OOS PF collapse.
6. What a real test would require (not free)
A point-in-time, survivorship-bias-free, multi-year (ideally 2005–2025) dataset with consensus EPS and management guidance — e.g. a paid vendor (Refinitiv/IBES, Zacks, FactSet, or a clean Compustat+IBES merge). Without that, PEAD stays out of scope for this free-data validation program. No v2 on free data.
7. Backtest-vs-live expectation delta
Moot — the backtest itself is not trustworthy. Even taken at face value, live would be worse: survivorship bias removed (the universe would include the de-listed and the crashed), the guidance filter unavailable, crowding/decay continuing, and 2024–26 was an unusually strong tape.
Files: PRE_REGISTRATION.md, results.json (metrics + per-gate + data manifest), universe.py, fetch_data.py, engine.py, gates.py, run.py, charts/{equity,drawdown,placebo,walkforward,drift_curve}.png.
Charts & evidence
Frequently asked
Is pead profitable in 2026?
In this pre-registered backtest, pead returned a profit factor of 2.20 and passed 9/11 validation gates (placebo PASS). Verdict: INCONCLUSIVE. Every result is published, pass or fail.
Has pead been backtested honestly?
Yes — through The Validation Gauntlet, a pre-registered 11-gate framework (profit factor, deflated Sharpe, a random-permutation placebo, cost-stress and walk-forward) with the specification locked before any out-of-sample metric is computed.
Methodology: The Validation Gauntlet — pre-registered spec, 11-gate battery, real market data.
Full reproducible report: backtests/pead/REPORT.md in the source repository.
Author: Brent Akamine (Founder, Vinovest). Backtests are not investment advice.