TrendPullback EA
Multi-timeframe trend-pullback continuation
The closest retail miss. It has the positive-skew signature a trend system should have (winners 1.22× losers) and trades plenty, but a 41.7% win rate where ~47% is breakeven. Right-shaped, wrong-calibrated — net-negative in every segment, pair, parameter neighbour, cost level and clock offset.
- Category
- Trend
- Window
- 2018–2026 (8.5y)
- Instruments
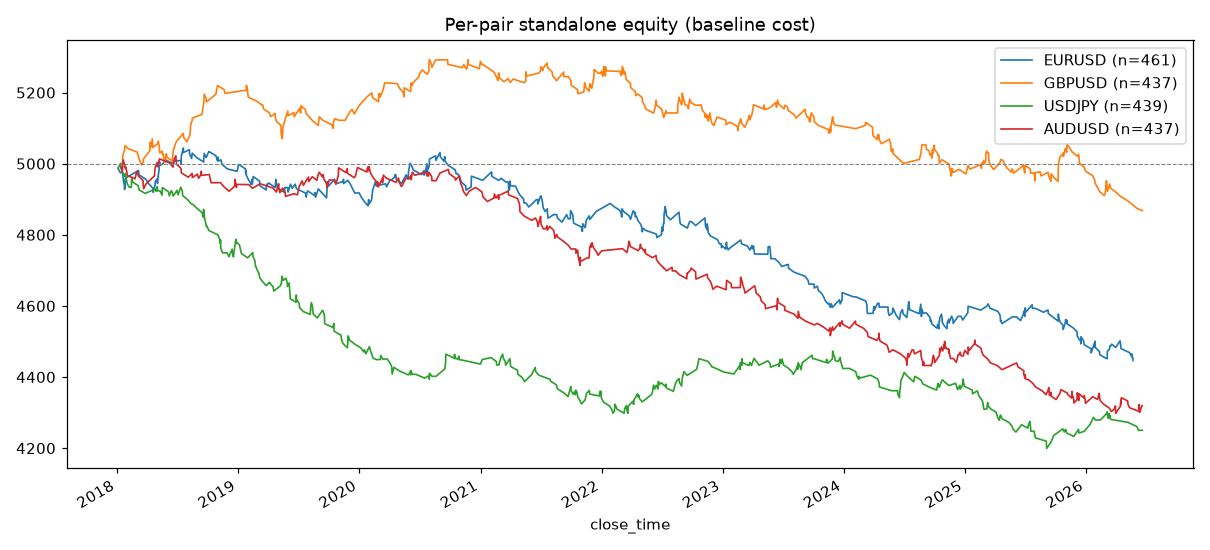
- EURUSD, GBPUSD, USDJPY, AUDUSD
- Timeframe
- H4 / H1 / M15
- Tested
- 2026-06-20
The story in one line
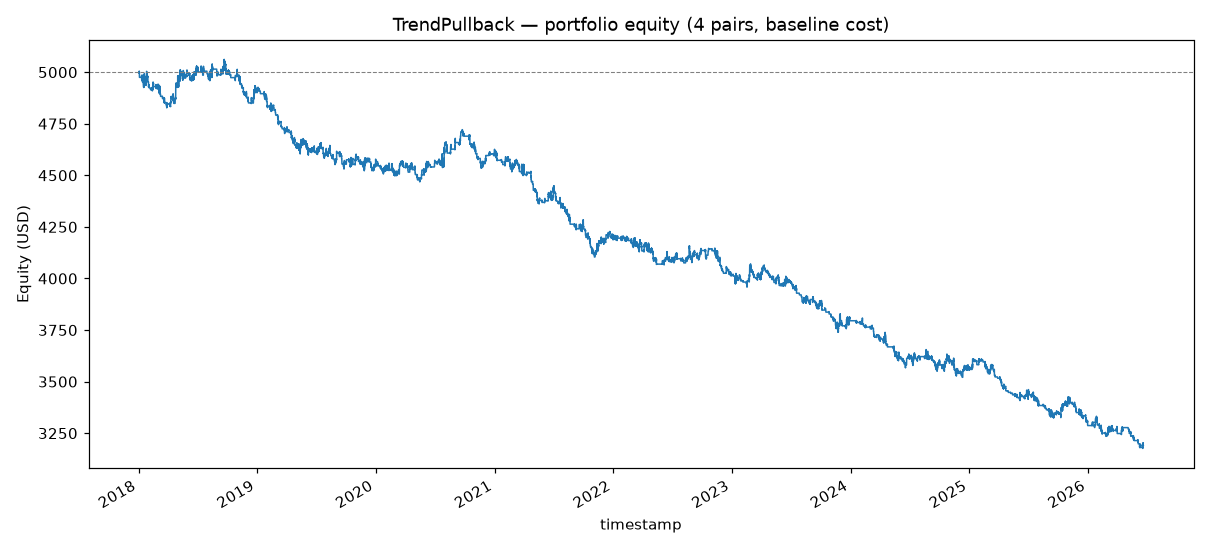
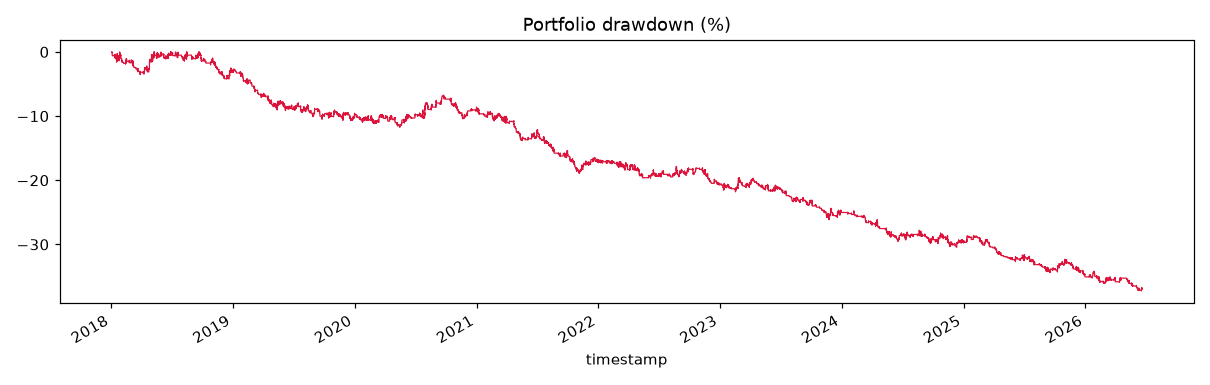
TrendPullback is the structurally closest of the archetypes tested — and it still loses. Run on real 2018–2026 M5-derived data across four majors, it finishes −$1,808 (−36.2%), profit factor 0.803, Sharpe −1.27, max drawdown 37.3% unprotected, on 1,763 trades (208/yr). Unlike the no-edge night-revert experiment it trades plenty and it has the positive-skew signature a trend system is supposed to have. It is the most promising shape any retail-style signal has produced here — and it is still a net loser. No production module was written. Do not deploy.
The core arithmetic
The trend skew is genuinely present: the average winner runs 31.1 pips against an average loser of 25.5 pips — a 1.22× payoff in pips. But the trade outcomes don’t monetise it. Only 15% of trades reach the 2R target; 54% stop out and the remaining 23% are trailed out before 2R. That produces a win rate of 41.7%. At the realised payoff ratio the gross break-even win rate is 47.1%, so the strategy is ~5 points of hit-rate short of viability before costs — and costs then widen the gap. It is right-shaped but wrong-calibrated: the skew is real, the hit-rate is the thing that isn’t there.
Per-segment performance
| Segment | n | PF | Win% | Net $ | Win/Loss pips | Positive? |
|---|---|---|---|---|---|---|
| Dev 2018–2021 | 826 | 0.835 | 43.1 | −796 | 1.29 | ❌ |
| Validation 2022–2023 | 419 | 0.850 | 42.2 | −382 | 1.15 | ❌ |
| Locked OOS 2024–Jun 2026 | 544 | 0.749 | 40.1 | −828 | 1.16 | ❌ |
Every segment loses; the locked OOS is the worst. The positive pip-skew holds in every segment (1.15–1.29×), confirming the signature is structural — and confirming that a structural skew is not enough. The 6-month walk-forward tells the same story: 13 windows, 1 positive, 12 negative, no persistence.
Stable, but stably losing
Across every perturbation — EMA ±20%, ADX, ATR-separation, RSI ±10, pullback/breakout lookbacks, reward:risk 1.5–2.5, stop buffer — the profit factor stays in a tight 0.79–0.86 band. That is stable within ±15%, so the robustness check technically passes, but it is stable around a loss. Not one of the 36 perturbations reaches PF 1.0; the surface is a flat, shallow loss everywhere, with no profitable neighbourhood to migrate toward. Cost and slippage stress only deepen it (PF 0.66–0.80), and the server-clock / DST offsets (−1h / default / +1h) all land net −$1,640 to −$1,808. No knob, cost level, pair or clock rescues it — the ~5-point win-rate deficit is baked into the signal, not reachable by a parameter sweep.
Verdict: REJECT (PF 0.803). Do not deploy. The closest retail miss tested — right structure, positive skew, real trade activity, but a sub-breakeven 41.7% win rate against a ~47.1% gross break-even. Robustly losing in every segment, pair, parameter neighbour, cost level and clock offset. Closing the win-rate gap is a genuine research problem, not a tuning exercise — and nothing in this data suggests the EA’s existing knobs get there.
Charts & evidence
Frequently asked
Why does a trend-pullback EA with positive skew still lose money?
Because the win rate is too low to monetise the skew. The EA shows the right structure — average winner 31.1 pips vs average loser 25.5 pips (1.22×) — but only 15% of trades reach the 2R target while 54% stop out, producing a 41.7% win rate. At that payoff ratio the gross break-even win rate is about 47.1%, so it is roughly 5 points of hit-rate short of viability before costs.
Was the trend-pullback strategy overfit?
No — it is robustly losing. Across 36 parameter perturbations the profit factor stays in a tight 0.79–0.86 band: stable, but stable around a loss. There is no profitable neighbourhood to migrate toward. Closing the ~5-point win-rate gap is a genuine research problem (better regime filter or trade location), not something the EA's existing knobs reach.
Methodology: The Validation Gauntlet — pre-registered spec, 11-gate battery, real market data.
Full reproducible report: backtests/trendpullback/REPORT.md in the source repository.
Author: Brent Akamine (Founder, Vinovest). Backtests are not investment advice.