



Averaging Grid Bot
BGD · Basket-Grid (operator-forex-001)
Martingale averaging grid with mean-reversion entry
Blew the $5k account to the ruin floor in ~15 months. A zero-cost control pins the basket at PF 1.01 — a coin flip with no directional edge; real spread + slippage then bleed it to ruin.
- Category
- Grid / Martingale
- Window
- 2023–2026 (3.4y)
- Instruments
- XAUUSD + 6 FX majors + NZDCHF
- Timeframe
- M15
- Tested
- 2026-06-20
Pending validation
A scaled equity curve appears here once this strategy clears the data needed to compute one honestly. We don't show a curve we can't stand behind.
See what the gates require →How it works
The bet
What market behavior this strategy is wagering on.
It wagers that price across a basket of gold and FX majors mean-reverts: every adverse move eventually retraces, so averaging into losers at staggered grid levels lets the basket exit green once the market snaps back.
How it decides
What makes it enter, size, and exit a position.
A mean-reversion trigger opens a position, then martingale grid levels add size as price moves against it, lowering the average entry. It exits on a basket profit target or a 4-hour timeout, with kill switches, a recovery throttle, and a regime veto bounding risk.
How it can break
The regimes and failure modes that turn the edge negative.
There is no real entry edge, so the strategy is negative wherever spread, slippage, and swap apply — every regime. Trending or gapping markets (news spikes, de-pegs) margin-call the stacked grid before the retrace arrives, forcing losers shut at the worst tick.
Explainer compiled 2026-06-28 · opus-4.8
Market context
Live chart
Chart powered by TradingView. Live prices can differ from the point-in-time dataset used in the published test.
The story in one line
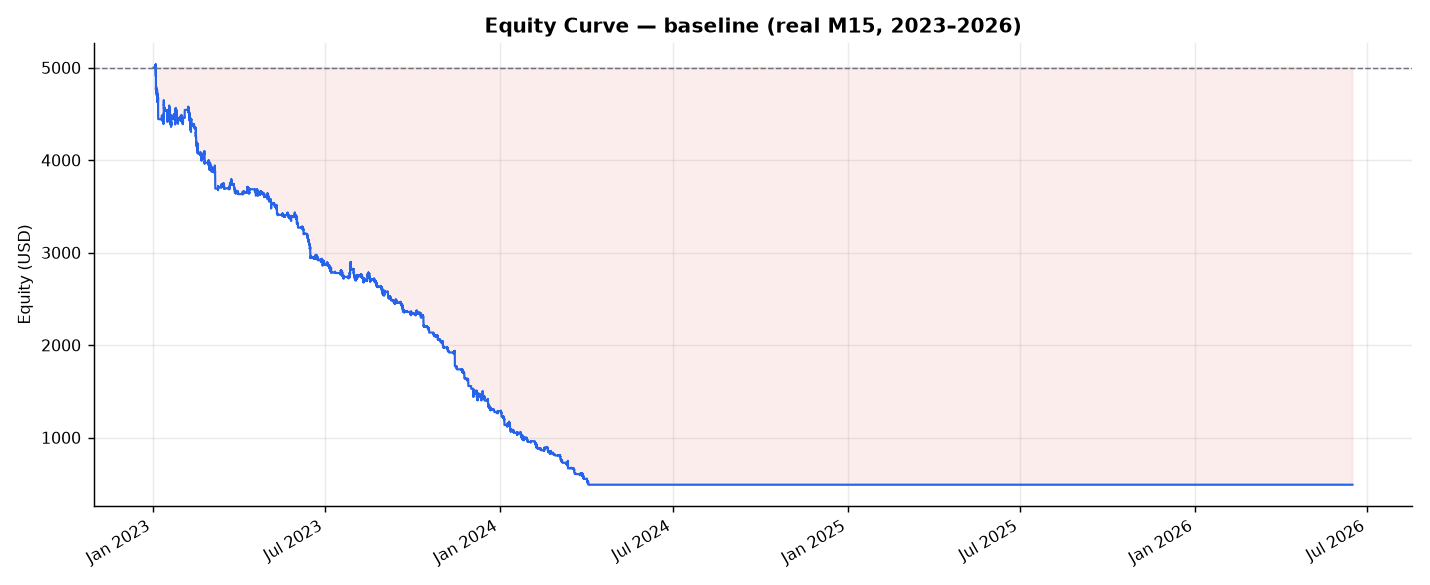
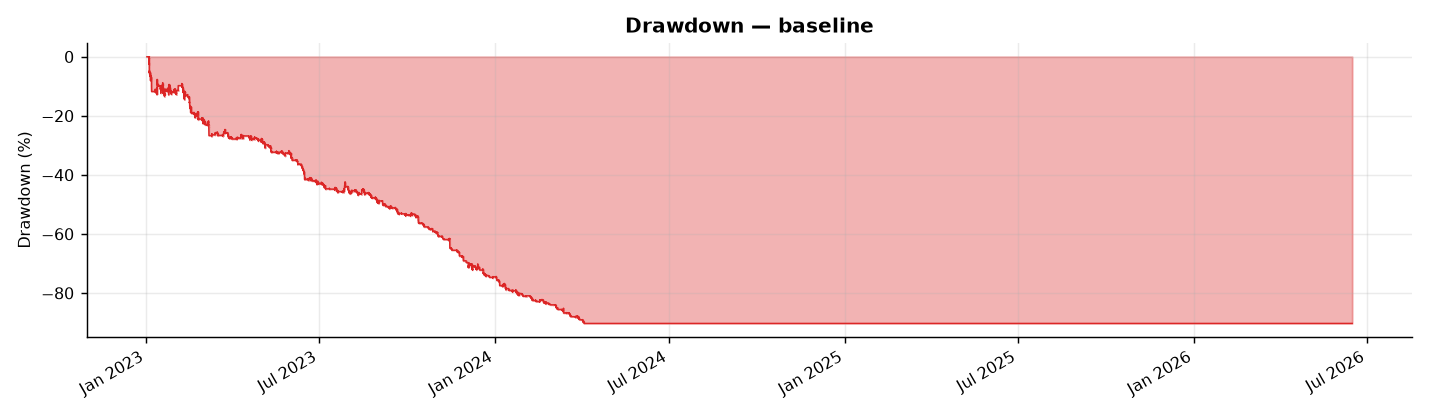
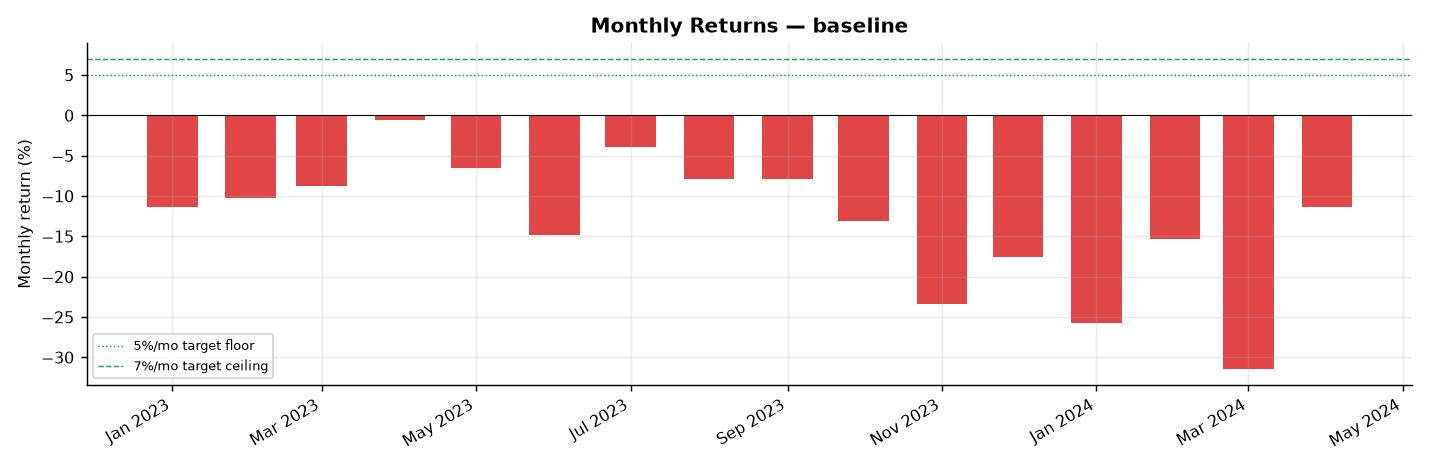
Run exactly as specified over 3.4 years of real M15 data, the basket-grid bot does not hit its 5–7%/mo target — it loses money and blows the account. From a $5,000 start it bled to $490 (−90.20%) and hit the ruin floor on 2024-04-02, ~15 months in, then sat flat (dead). Across 1,276 baskets the win rate was 37.5%, profit factor 0.514, monthly Sharpe −5.56, max drawdown −90.26%, and 0 of 16 months were profitable (average month −13.1% against a +5–7% target).
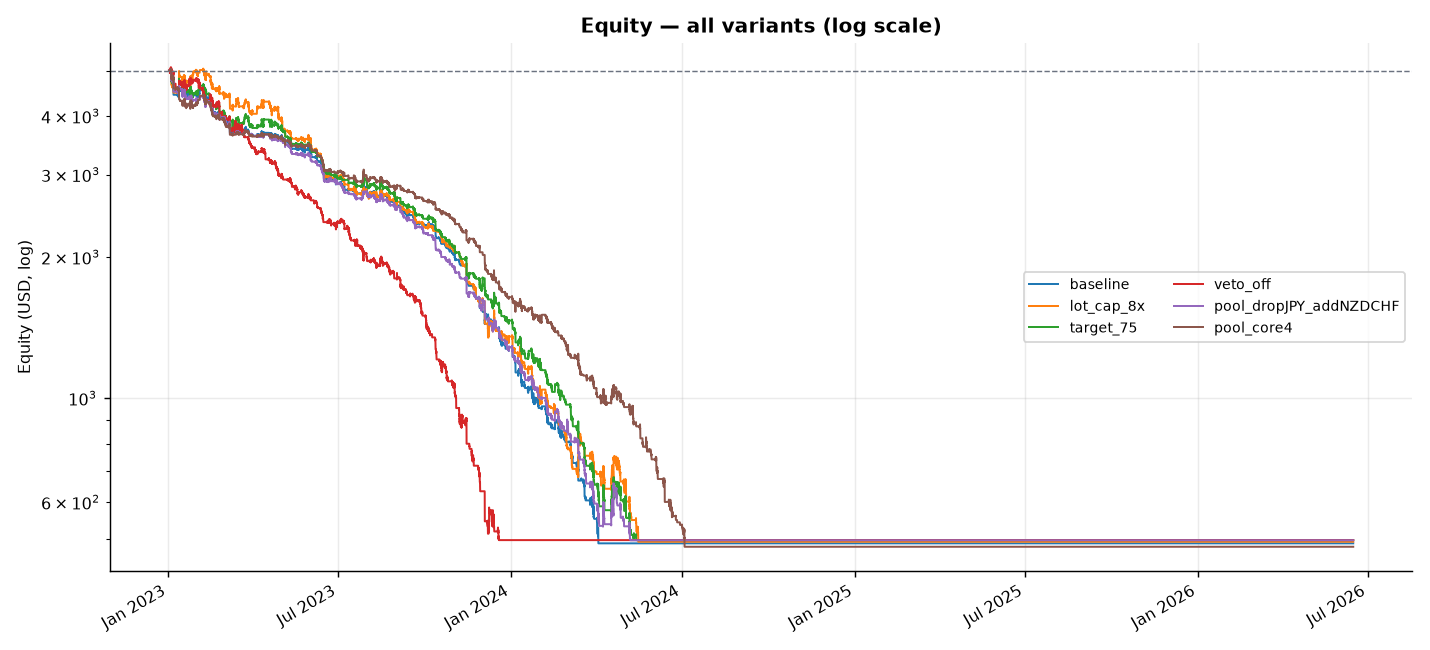
The kill-switches, recovery throttle, two-strike override, and regime veto all fired as designed. They slowed the bleed; none of them made the bot profitable. The safety net catches the fall — it does not turn a losing strategy into a winning one.
Why it loses — the zero-cost control
Same engine, same data, peeling back one cost layer at a time to locate the loss:
| Variant | Final $ | Baskets | Win rate | Mean P/L / basket | Profit factor |
|---|---|---|---|---|---|
| As specified (grid + real costs) | $490 | 1,276 | 38% | $-3.53 | 0.51 |
| Grid, zero cost (no spread/slip/swap) | $5,282 | 3,826 | 54% | $0.07 | 1.01 |
| No grid, zero cost (pure entry edge) | $5,384 | 3,938 | 51% | $0.10 | 1.01 |
The read-out: strip the costs and the system sits at profit factor ~1.01 / ~54% win — a coin flip with no directional edge. Removing the martingale grid on top changes almost nothing (no-grid ≈ grid). The entire live loss is transaction cost applied to a zero-edge bet, compounded over thousands of baskets at roughly $3–5/basket. The spec fully defines the risk machinery but never defines an entry edge — and without one, no amount of basket, grid, or kill logic is profitable. Year by year the zero-cost edge stays flat (avg basket ≈ $0, win 52–56% in 2023–2025); there is no regime in which it earns its keep.
Backtest-vs-live: every bias points to optimism
Basket grids usually flatter themselves in backtest because historical data always retraces eventually — the simulator lets every adverse excursion mean-revert, while a live account can margin-call or stop out before the retrace arrives. Survivorship (no CHF-style de-pegs), slippage (fixed pips vs stops filling 10–50 pips worse in the exact news spikes where grids must exit), spread regime (constant vs widening 3–10× when the grid martingales hardest), and broker stop-out (a hard 10% ruin floor vs a real margin call that liquidates all seven grids at the worst tick) all point the same way: toward optimism. And the trap is that this backtest already loses — it doesn’t even get the flattering phase, because the 4h timeout and hard stops force the grid to realise its losers before the retrace. A live account would do everything this run does, only worse, with a real margin cliff the ruin floor only approximates.
Verdict: FAIL (PF 0.514). Do not deploy. Not close. The account hit the ruin floor in ~15 months, lost ~90% of capital, and was negative every month. The decisive control — strip costs and the basket sits at PF 1.01, a coin flip — shows the failure is structural: there is no entry edge for the grid to compound, only the absence of one. No risk-limit tuning changes that; the problem is upstream of risk. Basket-grid is retired.
Charts & evidence
Frequently asked
Do martingale basket-grid forex bots work?
Not on a real cost model. Run spec-exact on 2023–2026 M15 data, this basket-grid bot lost money every way it was measured — profit factor 0.514, −90% drawdown, account blown to the ruin floor in about 15 months. With transaction costs removed it sits at profit factor 1.01 (a coin flip), so there is no directional edge for the grid machinery to compound.
Why did the grid bot blow the account?
Not the grid sizing or the kill-switches — the absence of an entry edge. The spec fully defines the risk machinery (kill switches, recovery, two-strike override, regime veto) but never defines a directional entry rule. Risk management cannot manufacture alpha; once real spread and slippage hit a zero-edge bet across thousands of baskets, the expectancy is reliably negative.
Methodology: Independent research screen — the full 11-gate battery was not run; data and execution limits are stated in the report. Full reproducible report: backtests/report.md in the source repository.Author: Validated Research Team (Methodology v1.0 — 11-gate validation). Backtests are not investment advice.