



Currency Carry Trade
CRY · FX Carry (Hardened v2)
Cross-sectional G8 interest-rate carry
Lost money over a full 15-year sample; the rate-ranked signal was beaten by 33% of random sign-permutations. v1's PF 1.17 was a 2023–26 subsample artifact. Carry retired.
- Category
- Carry
- Window
- 2011–2026 (15.4y, 796 weekly rebalances)
- Instruments
- G8 FX majors (real Dukascopy daily + real USDCHF)
- Timeframe
- Weekly rebalance
- Tested
- 2026-06-21
Strategy returns include costs and slippage. Benchmark comparison (vs the category primary and the S&P 500 total return) is backfilling and not shown yet — we don't plot a line we can't source.
How it works
The bet
What market behavior this strategy is wagering on.
It wagers on the forward-premium puzzle: that high-interest-rate G8 currencies keep paying their rate differential without depreciating enough to wipe out the carry, so a long-high, short-low rate basket earns the spread.
How it decides
What makes it enter, size, and exit a position.
Each week it ranks the G8 majors by policy interest rate, goes long the highest-yielders and short the lowest, then de-grosses exposure with a reactive VIX and 12-month-drawdown overlay before rebalancing the following week.
How it can break
The regimes and failure modes that turn the edge negative.
It turns negative in ZIRP eras with no carry to harvest and in USD super-cycles or peg breaks (2014–15, the 2015 CHF de-peg), where high-yielders depreciate far more than they pay and the reactive overlay locks in the losses.
Explainer compiled 2026-06-28 · opus-4.8
The story in one line
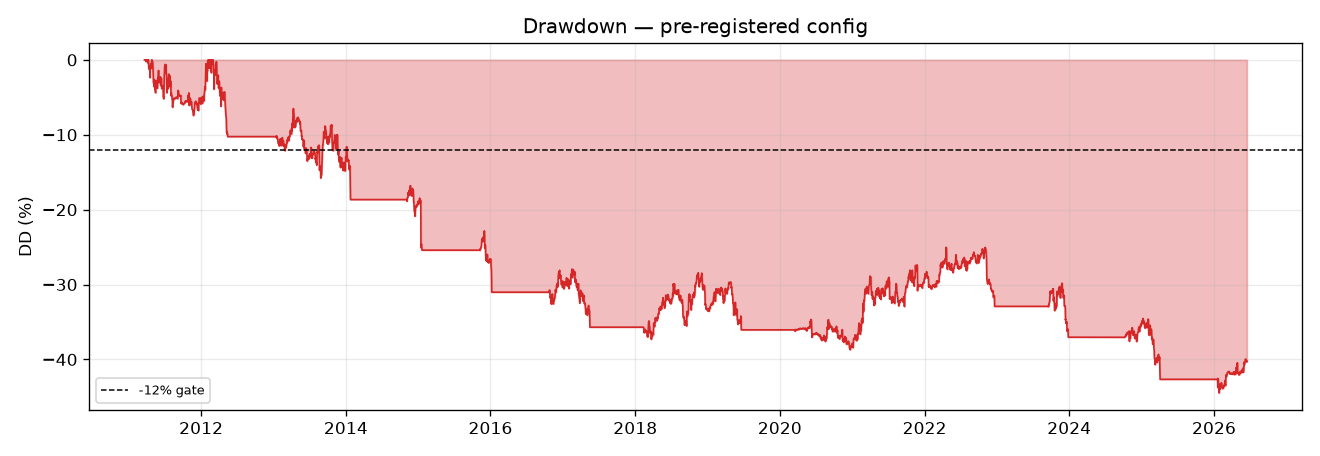
Run exactly as pre-registered over a full 15-year sample, hardened cross-sectional FX carry loses money: final $3,392 (−32%), CAGR −2.5%, profit factor 0.844, Sharpe −0.29, max drawdown −44.5%. It passes 3 of 11 gates — and all three are trivial (≥100 weeks; low concentration, which here only means it loses broadly). All eight substantive gates fail.
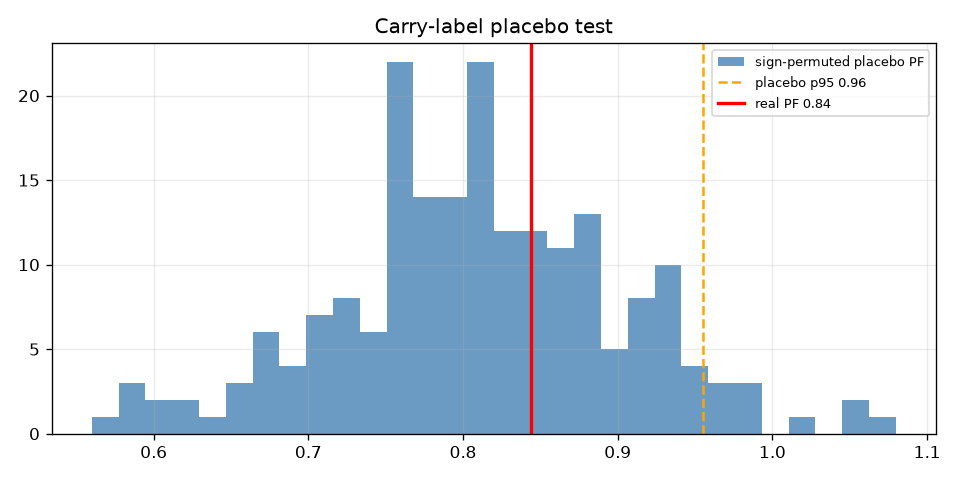
The decisive result is the carry-label placebo: the real strategy (PF 0.844) is beaten by 33% of random sign-permutations and sits below the placebo 95th percentile (0.955). Over 2011–2026, ranking currencies by interest rate was worse than random. The high-yielders depreciated more than they paid in carry — the forward-premium puzzle did not pay on G10 majors in this era.
Per the frozen multi-testing rule, v2 failed → no v3. Carry is retired — the 6th archetype to fail honestly.
Gate scorecard — 3 / 11
| # | Gate | Result | Pass |
|---|---|---|---|
| 1 | ≥ 100 weekly rebalances | 796 | ✅ |
| 2 | PF ≥ 1.20 net | 0.844 | ❌ |
| 3 | Annualized Sharpe ≥ 0.6 | −0.29 | ❌ |
| 4 | Max DD ≤ 12% | −44.5% | ❌ |
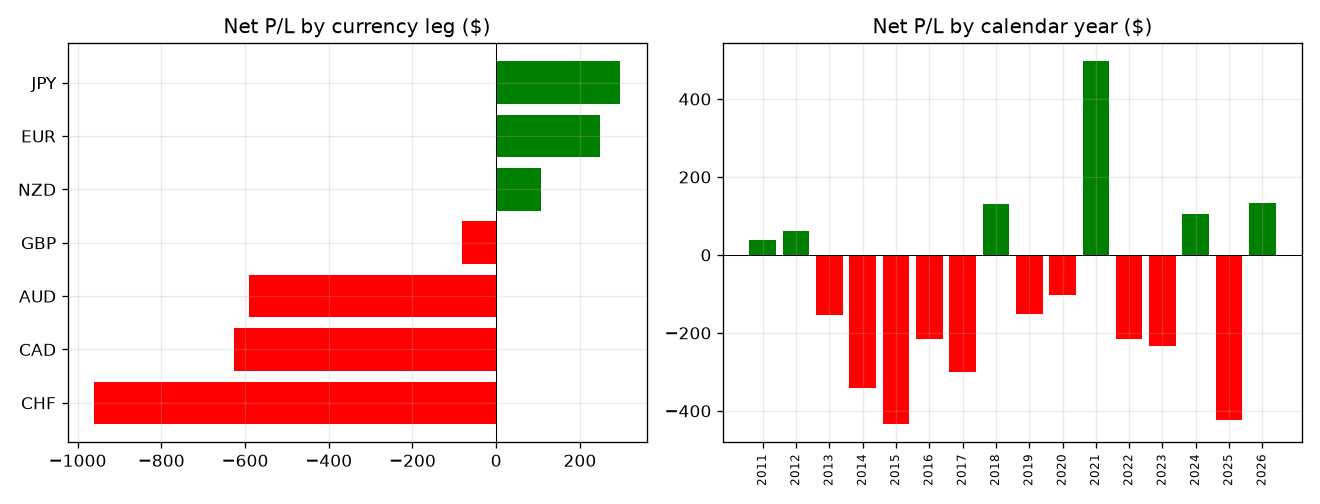
| 5 | Positive in ≥ 60% of years | 38% | ❌ |
| 6 | Block-bootstrap 95% LB Sharpe > 0 | −0.83 | ❌ |
| 7 | Carry-label placebo: real PF > p95 | 0.844 < 0.955 | ❌ |
| 8 | 2× cost stress: PF > 1.0 | 0.839 | ❌ |
| 9 | Deflated Sharpe positive | DSR 0.012 | ❌ |
| 10 | No currency > 40% of P/L | max 33% (CHF) | ✅ |
| 11 | No calendar year > 40% of P/L | max 14% | ✅ |
Gates evaluated on the base pre-registered config (overlay + 75 bp financing drag). No configuration was selected post-hoc to pass.
Why it fails — root cause
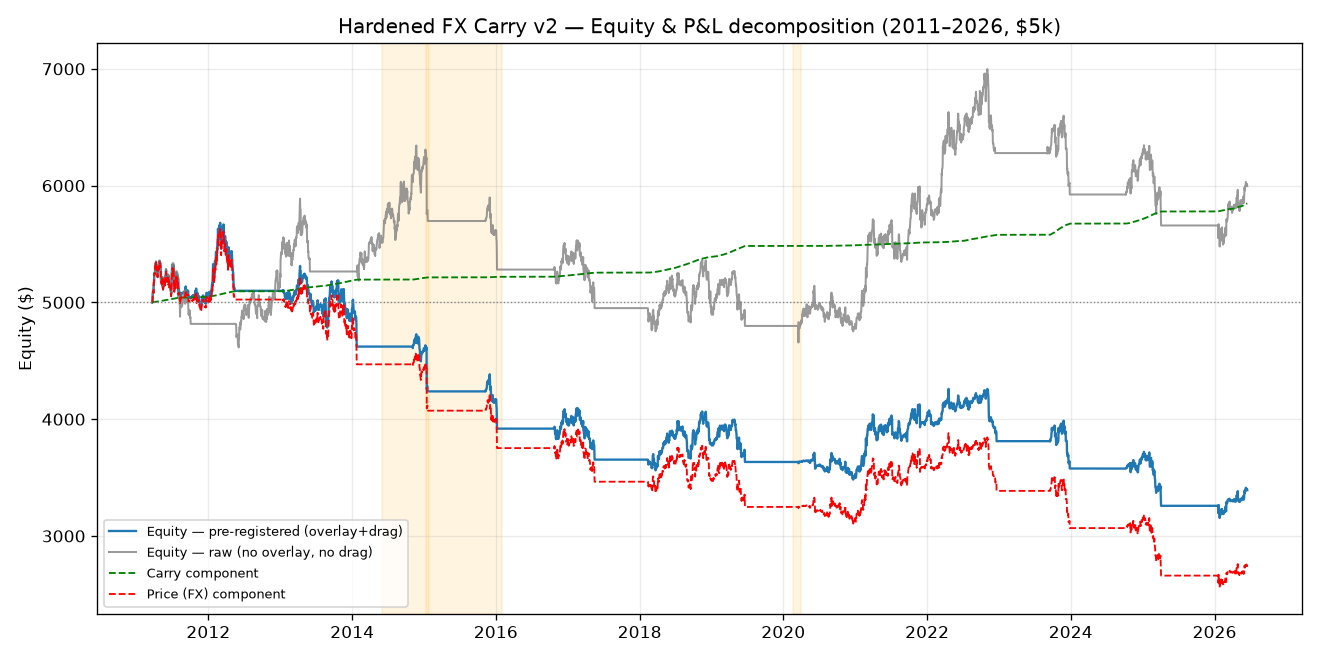
(a) The carry edge in G10 is real but tiny post-GFC, and FX drift dwarfs it. Decomposition: cumulative carry +$848, FX price −$2,261, costs −$195. The interest differential earned a slow trickle because 2011–2021 was a near-universal ZIRP era — there was almost no carry to harvest — while the FX leg lost 4× what carry earned. This matches the well-documented “lost decade” for G10 carry.
(b) The signal underperforms random. 33% of random currency-sign assignments beat the real rate-ranked strategy. Whatever P/L exists is not attributable to the carry signal.
(c) The crashes are real and concentrated in the FX leg. CHF −$961 (short-CHF blew up at the Jan-2015 SNB de-peg — USDCHF gapped ~−15% intraday); CAD −$626 and AUD −$591 (long high-yielders through the 2014–15 USD super-cycle). These are the canonical carry-crash mechanism.
(d) The risk overlay made it worse. Raw (no overlay) finishes $5,996 (PF 1.068); pre-registered (overlay + drag) finishes $3,392 (PF 0.844). The VIX de-gross and 12-month drawdown circuit are reactive — they cut exposure after drawdowns begin and stay de-grossed through recoveries, locking in losses. A reactive overlay cannot rescue a signal with no in-sample edge — it can only bleed it. This transferable lesson held in every test, including the 2008 GFC stress appendix (−17.0% with overlay vs −17.5% without).
Reconciling v1 (PF 1.17) with v2 (PF 0.844)
Not a contradiction — sample selection. 2023–2026 was a rare confluence: the largest G10 differentials in 15 years and no grinding carry crash. Measure a strategy on its best regime and it looks deployable; measure it across regimes and the truth surfaces. The two runs also used independent rate sources and v2 used real USDCHF — a genuine independent validation that overturns v1.
Honest caveats
Hand-coded policy rates (small errors can’t flip a placebo-below-random result), 2025–26 rates are a partial reconstruction affecting only the last ~10% of the sample, daily resolution (captures the 2015 CHF gap; intraday was worse). A broad EM carry basket — where the literature’s premia actually live — is a different archetype and instrument set, out of scope for a $5k retail MT5 account.
Verdict: FAIL (PF 0.844). Do not deploy. Not close. Carry is retired as a standalone deployable archetype. What it taught us — that reactive risk overlays destroyed value in every test — is kept as a project-wide lesson.
Equity curve
Growth of $5,000, cost-inclusive. Coded from the committed backtest series — not an image. Agents: GET /api/v1/strategy/CRY/equity
Charts & evidence
Frequently asked
Does the FX carry trade still work in 2026?
Not on G10/G8 majors for a small retail account. Run as pre-registered over a full 2011–2026 sample, hardened cross-sectional carry returned a net profit factor of 0.844 (below 1.0), a Sharpe of −0.29, and a −44.5% max drawdown. The interest differential earned a thin trickle while the FX/price leg bled roughly 4× as much. The academic carry premium lives largely in 1980s–2000s data and in broad EM baskets, not post-2008 G10.
Why did carry v1 show a profit factor of 1.17 but v2 show 0.844?
Sample selection. v1 measured only 2023–2026 — the largest G10 rate differentials in 15 years (Fed 5.4% vs BoJ −0.1%) with no grinding carry crash. Extended to the full 2011–2026 window with the real 2014–15 USD super-cycle, the 2015 CHF de-peg and COVID, the edge evaporated. This is exactly the failure that pre-registration plus a long sample is designed to catch.
Did the risk overlay help the carry strategy?
No — it made it worse. The raw signal (no overlay) finished at PF 1.068; adding the pre-registered VIX/drawdown de-gross overlay dropped it to PF 0.844. Reactive de-grossing cuts exposure after drawdowns begin and stays cut through the recovery, locking in losses. This held even in the 2008 GFC stress appendix.
Methodology: 11-gate validation — pre-registered spec, 11-gate battery, real market data. Full reproducible report: backtests/carry_hardened/REPORT.md in the source repository.Author: Validated Research Team (Methodology v1.0 — 11-gate validation). Backtests are not investment advice.