



Gold Opening-Range Breakout
ORB · Opening Range Breakout (XAUUSD)
NY 30-minute opening-range breakout
Retire archetype — placebo failed. Just 2 of 11 gates: PF 0.93, Sharpe −0.20, −72.7% drawdown. The breakout signal does not beat a random-entry placebo on gold.
- Category
- Intraday breakout
- Window
- 2017-01-03 → 2026-06-19
- Instruments
- XAUUSD (gold)
- Timeframe
- M5 intraday
- Tested
- 2026-06-19
Strategy returns include costs and slippage. Benchmark comparison (vs the category primary and the S&P 500 total return) is backfilling and not shown yet — we don't plot a line we can't source.
How it works
BackfillingThe bet
What market behavior this strategy is wagering on.
Plain-English explainer is backfilling — check back tomorrow. We publish the explanation only once it's written and reviewed, never auto-filled.
How it decides
What makes it enter, size, and exit a position.
Plain-English explainer is backfilling — check back tomorrow. We publish the explanation only once it's written and reviewed, never auto-filled.
How it can break
The regimes and failure modes that turn the edge negative.
Plain-English explainer is backfilling — check back tomorrow. We publish the explanation only once it's written and reviewed, never auto-filled.
Market context
Live chart
Chart powered by TradingView. Live prices can differ from the point-in-time dataset used in the published test.
Gate scorecard — 2 / 11
auto-imported from results.json| # | Gate | Result | Pass |
|---|---|---|---|
| 01 | Minimum sample | 2390 trades/periods | ✓ |
| 02 | Profit factor ≥ 1.20 | PF 0.934 | ✗ |
| 03 | Sharpe ≥ 0.6 | Sharpe -0.20 | ✗ |
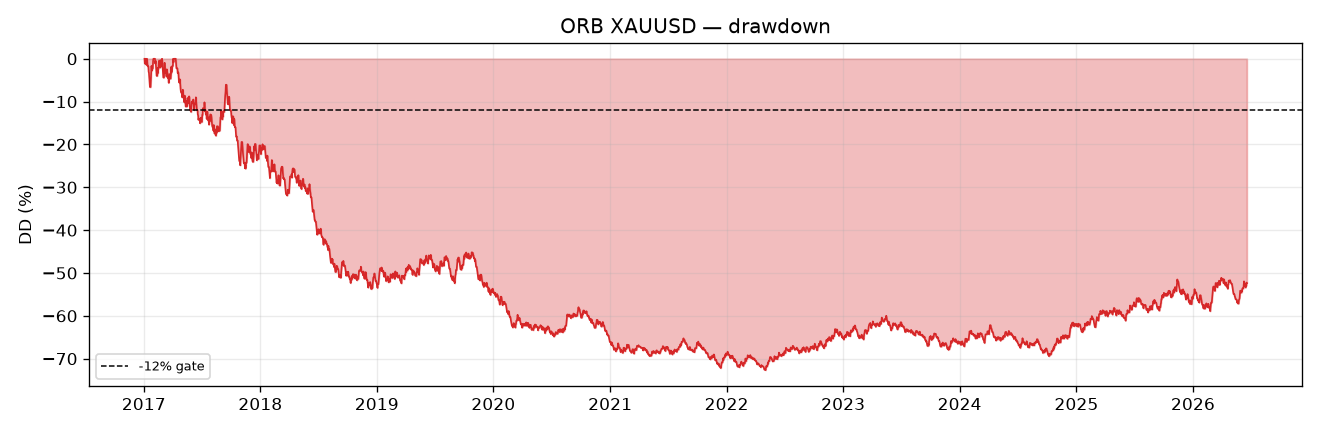
| 04 | Max drawdown ≤ 12% | MaxDD -72.7% | ✗ |
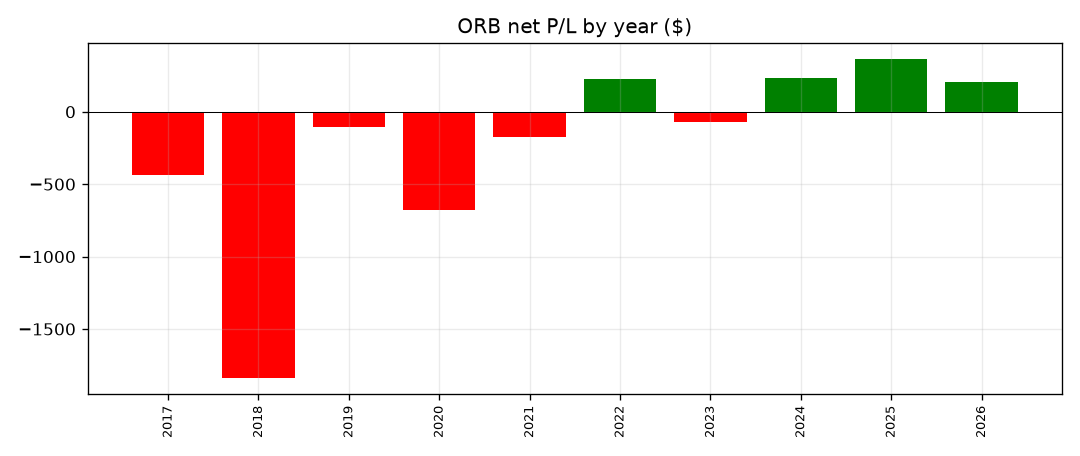
| 05 | Positive ≥ 60% of periods | 40% years positive | ✗ |
| 06 | Bootstrap LB Sharpe > 0 | 95% LB Sharpe -0.75 | ✗ |
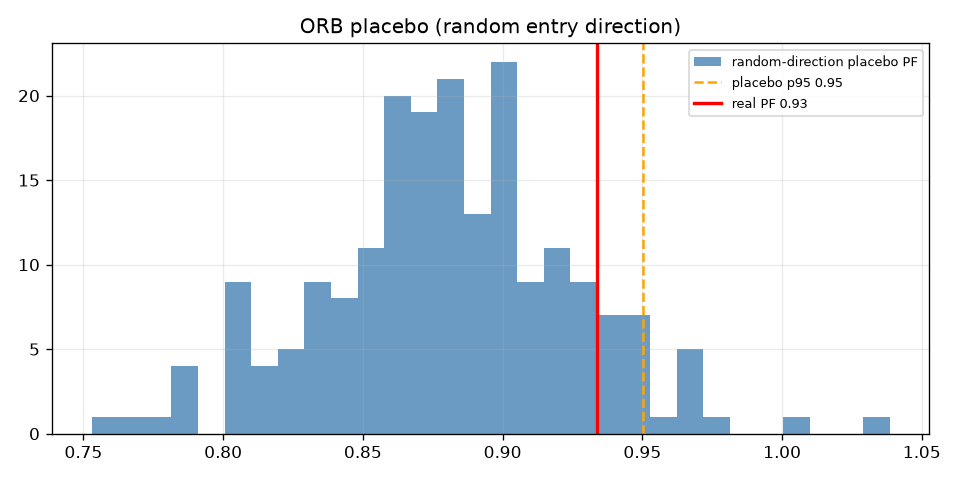
| 07 | Placebo beats p95 | real PF 0.934 vs placebo p95 0.950 | ✗ |
| 08 | 2× cost stress PF > 1.0 | 2x-cost PF 0.695 | ✗ |
| 09 | Deflated Sharpe positive | SR_hat -0.20 vs SR0 0.52, DSR=0.004 | ✗ |
| 10 | No component > 40% | max year share 43% | ✗ |
| 11 | Walk-forward OOS ≥ 0.9× IS | OOS/IS PF 1.22 (IS 0.89, OOS 1.08) | ✓ |
Verdict: RETIRE ARCHETYPE (no v2). Placebo failed. 2/11 gates.
The opening-range breakout direction on XAUUSD carries no information: the real strategy’s net profit factor (0.934) is below the 95th percentile of a random-entry-direction placebo (0.950) and sits inside the random distribution (only 11.5% of random runs beat it). Every stop/target variant loses money. This is the kill-shot gate doing its job — the edge is absent, not merely cost-eroded.
Pre-registration (frozen before results inspected)
- Primary config (gated): OR = high/low of M5 bars in
[13:30, 14:00)UTC; enter on first break of OR high (long) / low (short) on a bar ≥14:00; stop = opposite side of OR (R = OR width); target = 2R; abandon if no break by 17:00 UTC; one trade per session; exit remainder at last bar ≤21:00 UTC. - Risk: 1% of equity at 1R. Cost: 0.40 $/oz round-turn (spread+slippage ≈ “30–50 points”, 1 pt = $0.01). 2× cost = 0.80.
- Sensitivity (reported, not gated): stop ∈ {range, fixed 0.5·OR}, target ∈
{2R, EOD} → 4 variants. DSR multi-test budget
N_TRIALS=4. - Gates: the standard 11-gate battery (
backtests/_shared/gatelib.py), the same set that retired Carry, NMR, D1-trend, basket-grid, V6/CORE, Fury, TPB. - Data: Dukascopy spot XAU/USD M5, 2017-01-03 → 2026-06-19 (670,927 bars, 2,390 valid NY sessions). BID; spread modelled in the sim.
Sensitivity grid (all 4 variants — none gated, all lose)
| stop / target | trades | PF | net $ |
|---|---|---|---|
| range / 2R (primary) | 2390 | 0.934 | −2,274 |
| range / EOD | 2390 | 0.978 | −752 |
| fixed 0.5·OR / 2R | 2390 | 0.548 | −4,989 |
| fixed 0.5·OR / EOD | 2390 | 0.596 | −4,919 |
No variant clears PF 1.0. The tighter fixed stop is strictly worse (chopped out by intraday noise). EOD exit reduces the bleed vs 2R but never turns positive.
Root cause
The 2R target with a range-width stop has a ~33% breakeven win rate; realised win rate falls short once cost and the frequent same-session stop-out are paid. More fundamentally, gate 7 shows the entry direction is random: a coin-flip on long-vs-short breakout produces the same PF distribution. There is no momentum follow-through after the NY-open range break in gold over 2017–2026; the strategy is paying spread to express a non-signal.
Walk-forward (g11) “passes” only because the strategy loses slightly less in the recent third — a stability artifact on a losing system, not evidence of edge.
Decision
Per the pre-registered rule: placebo failed → RETIRE ARCHETYPE, no v2. No parameter search, no alternate session window, no filter overlay will be tested — that path is how false positives are manufactured. ORB on XAUUSD is closed.
Charts
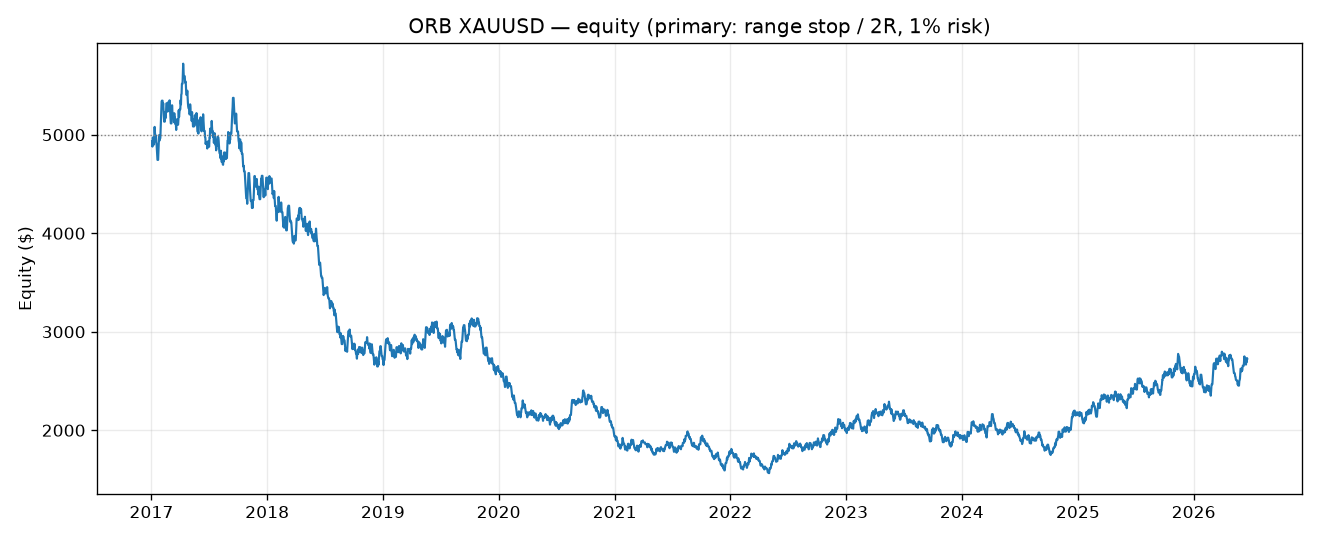
charts/equity_curve.png— equity ($5k → $2.7k)charts/drawdown.png— drawdown vs −12% gatecharts/placebo.png— real PF inside the random-direction distributioncharts/yearly_pnl.png— 6 of 10 years negative
Artifacts: results.json (full machine-readable gate verdicts), run.py (sim).
Equity curve
Growth of $5,000, cost-inclusive. Coded from the committed backtest series — not an image. Agents: GET /api/v1/strategy/ORB/equity
Charts & evidence
Frequently asked
Is Opening Range Breakout profitable in 2026?
In this pre-registered backtest (2017-01-03 → 2026-06-19), Opening Range Breakout (XAUUSD) returned a profit factor of 0.93 and passed 2/11 validation gates (placebo FAIL). Verdict: RETIRED. Every result is published, pass or fail.
Has Opening Range Breakout been backtested honestly?
Yes — through The Validation Gauntlet, a pre-registered 11-gate framework (profit factor, deflated Sharpe, a random-permutation placebo, cost-stress and walk-forward) with the specification locked before any out-of-sample metric is computed. It failed and is published anyway.
Methodology: 11-gate validation — pre-registered spec, 11-gate battery, real market data. Full reproducible report: backtests/orb_xauusd/REPORT.md in the source repository.Author: Validated Research Team (Methodology v1.0 — 11-gate validation). Backtests are not investment advice.