



ETH/BTC Pairs Trade
PAR · Pairs Trading ETH/BTC (Cointegration)
Cointegration mean-reversion statistical arbitrage
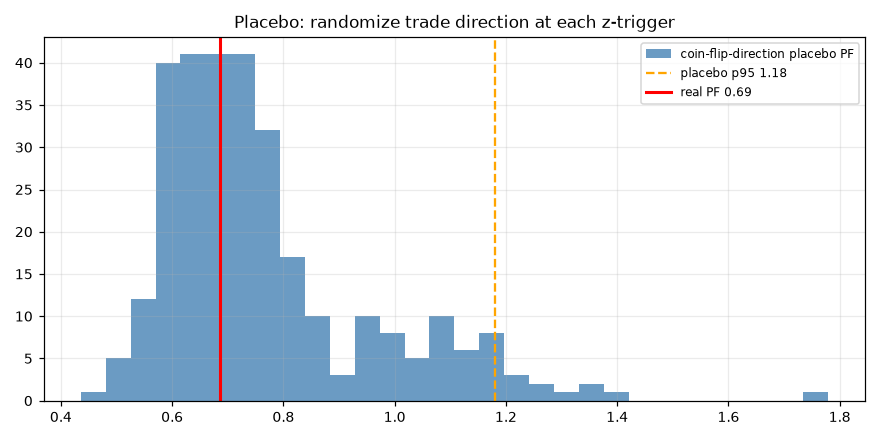
Placebo failed — 58% of random-sign permutations beat the real strategy. Only 46 trades in eight years, a −93% drawdown driven by the 2021 regime break, and in-sample PF 0.49 versus out-of-sample 1.34. The ETH/BTC cointegration relationship did not persist tradeably.
- Category
- Statistical arbitrage
- Window
- 2018–2026 (ETH vs BTC)
- Instruments
- ETH/BTC (crypto)
- Timeframe
- Daily, z-score spread
- Tested
- 2026-06-25
Measured equity history
Recorded directly from the chronological test ledger.
Shown in the backtest's native equity or cumulative P&L units. It is not scaled to an investment amount because the published artifact does not provide a defensible capital denominator.
How it works
The bet
What market behavior this strategy is wagering on.
It wagers that ETH and BTC are cointegrated, so their price ratio is tethered to a stable long-run band. When the spread stretches away from that band, the bet is it snaps back to its historical mean.
How it decides
What makes it enter, size, and exit a position.
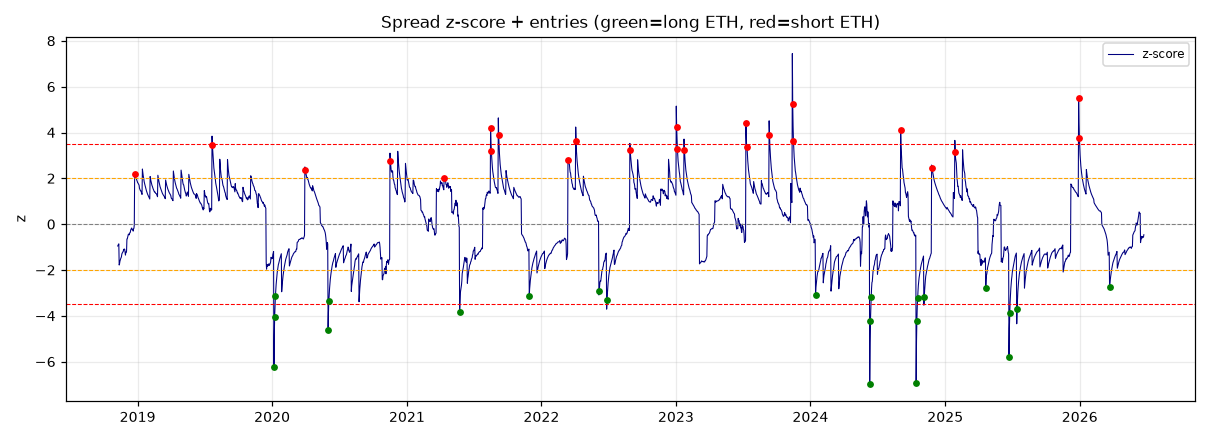
It z-scores the ETH/BTC spread on a daily basis, enters a mean-reversion position when the z-score reaches ±2 standard deviations, exits when it returns to zero, and stops out at ±3.5 standard deviations.
How it can break
The regimes and failure modes that turn the edge negative.
It dies in a regime break, where one leg structurally reprices against the other and the spread never reverts — as in 2021, when ETH repriced against BTC and the fade kept adding to a one-way move, driving the −93% drawdown.
Explainer compiled 2026-06-28 · opus-4.8
Market context
Live chart
Chart powered by TradingView. Live prices can differ from the point-in-time dataset used in the published test.
The story in one line
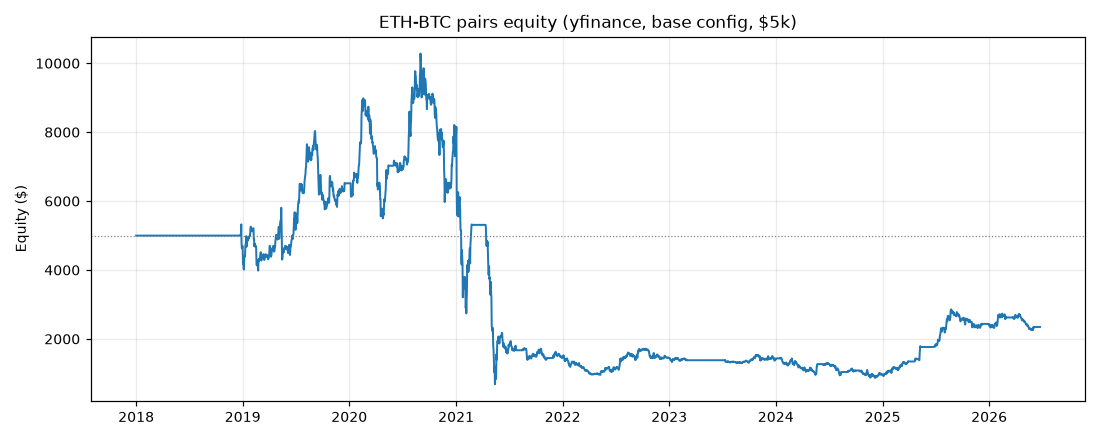
A textbook cointegration pairs trade on ETH/BTC — z-score the spread, fade it at ±2σ, exit at 0, stop at ±3.5σ — over 2018–2026 finishes at $2,349 from a $5,000 start (net −$2,651), profit factor 0.686, Sharpe 0.10, max drawdown −93.3%, on just 46 trades in eight years with a 50% win rate. It passes 2 of 11 gates, and both are technicalities (a positive deflated Sharpe driven by a near-zero raw Sharpe, and a walk-forward check the strategy “passes” only because in-sample is so bad that out-of-sample clears 0.9× of nothing). The decisive failure is the placebo: 58.3% of random-sign permutations beat the real strategy (real PF 0.686 versus placebo p95 of 1.181). The ETH/BTC relationship did not persist tradeably.
What the cointegration test showed
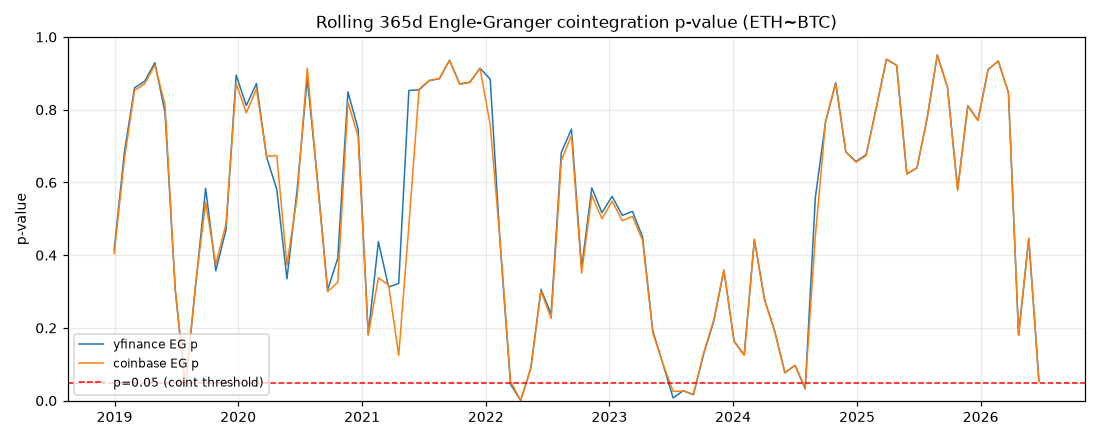
The pair never cleared a cointegration bar to begin with. Engle–Granger gives p = 0.322 (ETH on BTC) and p = 0.654 (BTC on ETH) — both far above 0.05 — and the residual ADF p-value is 0.139, so the spread is not stationary at any conventional level. The Johansen trace statistics (7.65 and 1.45) sit below their 95% critical values (15.49, 3.84), confirming no cointegrating vector. The estimated hedge ratio (β ≈ 1.05) is sensible, but the spread’s half-life of mean reversion is ~486 days — far too slow for a tradeable signal and longer than most of the holding windows the strategy actually used. Worst of all, the rolling cointegration fraction is just 7.6%: the relationship was cointegrated in only about one window in thirteen across the sample.
Why it fails
The signal underperforms random. In 300 sign-flipped permutations, 58.3% beat the real strategy and the placebo 95th percentile (1.181) sits well above the real PF (0.686). Whatever P&L exists is not attributable to the cointegration signal.
It barely trades. 46 trades in eight years — under six a year — fails the 100-trade minimum and means every result rests on a handful of events. There is no statistical mass here.
In-sample and out-of-sample disagree completely. IS PF 0.486 versus OOS PF 1.336. A real edge is stable across the split; this one inverts. The “passing” walk-forward gate is an artifact of how broken the in-sample half is, not evidence of robustness.
One year ate the account. The 2021 regime break dominates everything: −$6,116 in 2021 against gains of roughly +$1,517 (2019), +$1,046 (2020), and +$1,446 (2025). ETH structurally repriced against BTC and the mean-reversion bet — that the spread snaps back to its historical band — kept fading a move that did not revert, producing the −93.3% drawdown and a single-year P&L share of 56%.
Verdict: REJECTED (PF 0.686). Do not deploy. The pair is not cointegrated (EG p 0.32, ADF p 0.14, rolling coint 7.6%), the half-life (~486 days) is untradeable, and a random sign-flip beats the strategy 58% of the time. The ETH/BTC cointegration relationship did not persist tradeably over 2018–2026.
Charts & evidence
Frequently asked
Does ETH/BTC cointegration pairs trading work?
Not tradeably over 2018–2026. A z-score cointegration pairs strategy on ETH/BTC returned a profit factor of 0.686 with a −93% drawdown, and it failed the placebo test — 58% of random-sign permutations beat the real strategy. The relationship also broke between in-sample (PF 0.49) and out-of-sample (PF 1.34) windows, and the system took only 46 trades in eight years.
Why did the ETH/BTC pairs strategy have a 93% drawdown?
The 2021 regime break. ETH structurally repriced against BTC during 2021, and a mean-reversion spread trade that assumes the ratio returns to its historical band took a −$6,116 hit that year — the dominant loss in the whole backtest. Cointegration measured on history is not a guarantee the spread stays stationary, and here it did not.
Methodology: 11-gate validation — pre-registered spec, 11-gate battery, real market data. Full reproducible report: backtests/pairs_ethbtc/results.json in the source repository.Author: Validated Research Team (Methodology v1.0 — 11-gate validation). Backtests are not investment advice.