
Trend Pullback
TPP · TrendPullback EA
Multi-timeframe trend-pullback continuation
The closest retail miss. It has the positive-skew signature a trend system should have (winners 1.22× losers) and trades plenty, but a 41.7% win rate where ~47% is breakeven. Right-shaped, wrong-calibrated — net-negative in every segment, pair, parameter neighbour, cost level and clock offset.
- Category
- Trend
- Window
- 2018–2026 (8.5y)
- Instruments
- EURUSD, GBPUSD, USDJPY, AUDUSD
- Timeframe
- H4 / H1 / M15
- Tested
- 2026-06-20
Pending validation
A scaled equity curve appears here once this strategy clears the data needed to compute one honestly. We don't show a curve we can't stand behind.
See what the gates require →How it works
The bet
What market behavior this strategy is wagering on.
It bets that after an established multi-timeframe trend, a shallow pullback marks a low-risk re-entry into the prevailing direction, and that the resumed move runs far enough to pay winners more than the stops on failed pullbacks cost.
How it decides
What makes it enter, size, and exit a position.
It reads trend on H4, waits for a pullback on H1, and times entry on M15. Stops sit beyond the pullback with a target near 2R, so winners average 1.22× losers in pips; trades trail out if the move stalls before reaching target.
How it can break
The regimes and failure modes that turn the edge negative.
The edge turns negative when too few pullbacks resume far enough to hit the 2R target. At a 41.7% hit-rate against a ~47% breakeven, the real positive skew never gets monetised; choppy, range-bound majors and trading costs both widen that deficit.
Explainer compiled 2026-06-28 · opus-4.8
Market context
Live chart
Chart powered by TradingView. Live prices can differ from the point-in-time dataset used in the published test.
The story in one line
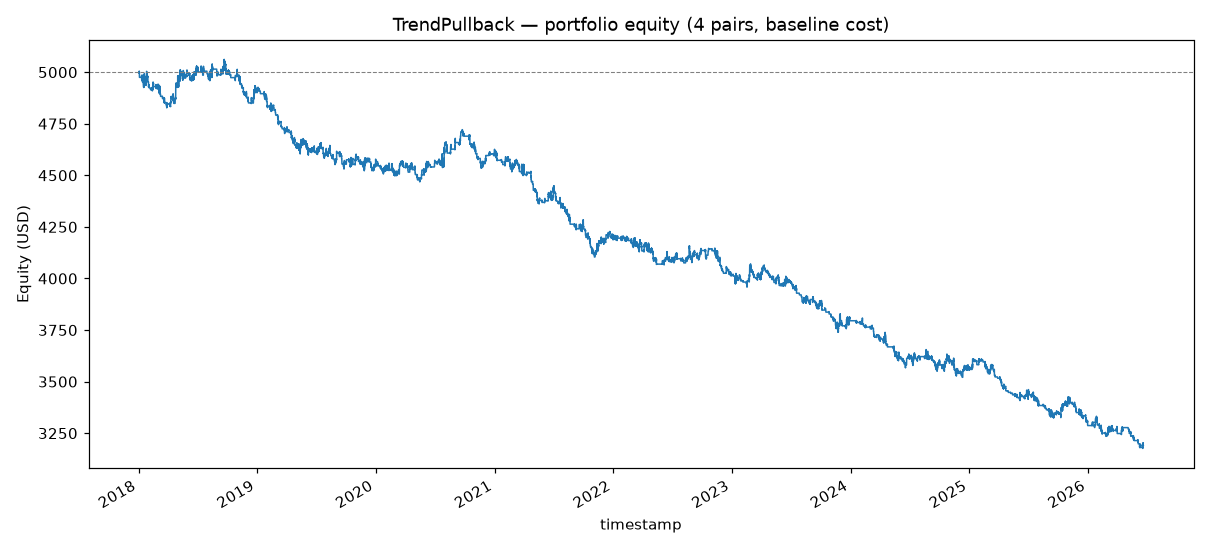
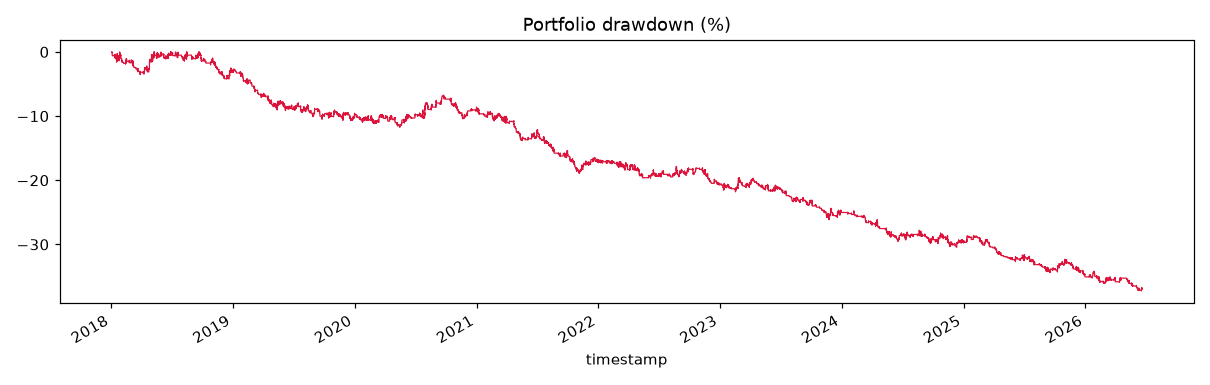
TrendPullback is the structurally closest of the archetypes tested — and it still loses. Run on real 2018–2026 M5-derived data across four majors, it finishes −$1,808 (−36.2%), profit factor 0.803, Sharpe −1.27, max drawdown 37.3% unprotected, on 1,763 trades (208/yr). Unlike the no-edge night-revert experiment it trades plenty and it has the positive-skew signature a trend system is supposed to have. It is the most promising shape any retail-style signal has produced here — and it is still a net loser. No production module was written. Do not deploy.
The core arithmetic
The trend skew is genuinely present: the average winner runs 31.1 pips against an average loser of 25.5 pips — a 1.22× payoff in pips. But the trade outcomes don’t monetise it. Only 15% of trades reach the 2R target; 54% stop out and the remaining 23% are trailed out before 2R. That produces a win rate of 41.7%. At the realised payoff ratio the gross break-even win rate is 47.1%, so the strategy is ~5 points of hit-rate short of viability before costs — and costs then widen the gap. It is right-shaped but wrong-calibrated: the skew is real, the hit-rate is the thing that isn’t there.
Per-segment performance
| Segment | n | PF | Win% | Net $ | Win/Loss pips | Positive? |
|---|---|---|---|---|---|---|
| Dev 2018–2021 | 826 | 0.835 | 43.1 | −796 | 1.29 | ❌ |
| Validation 2022–2023 | 419 | 0.850 | 42.2 | −382 | 1.15 | ❌ |
| Locked OOS 2024–Jun 2026 | 544 | 0.749 | 40.1 | −828 | 1.16 | ❌ |
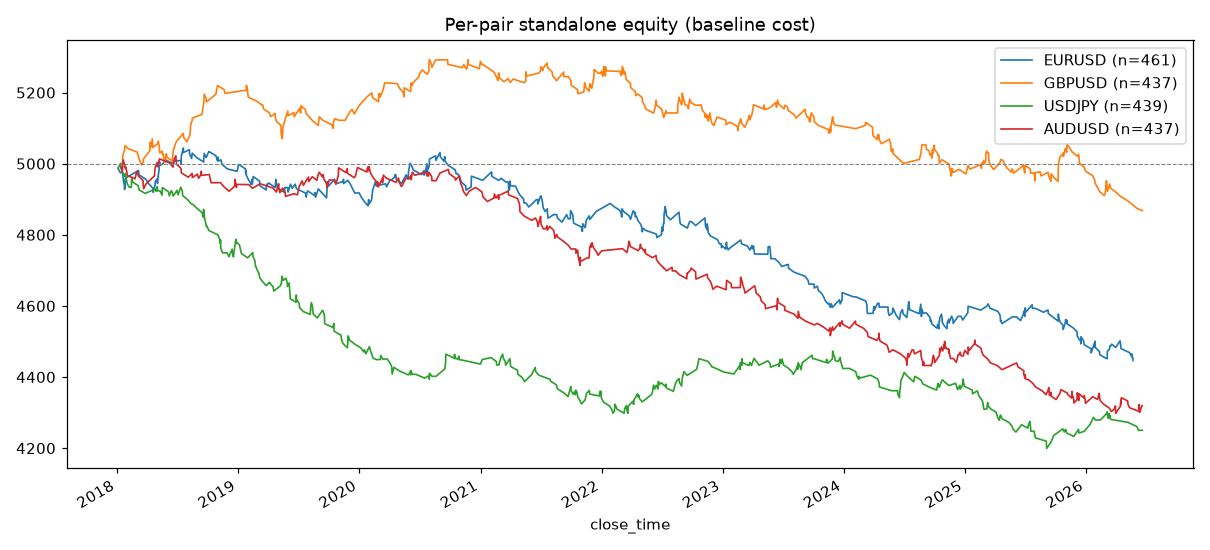
Every segment loses; the locked OOS is the worst. The positive pip-skew holds in every segment (1.15–1.29×), confirming the signature is structural — and confirming that a structural skew is not enough. The 6-month walk-forward tells the same story: 13 windows, 1 positive, 12 negative, no persistence.
Stable, but stably losing
Across every perturbation — EMA ±20%, ADX, ATR-separation, RSI ±10, pullback/breakout lookbacks, reward:risk 1.5–2.5, stop buffer — the profit factor stays in a tight 0.79–0.86 band. That is stable within ±15%, so the robustness check technically passes, but it is stable around a loss. Not one of the 36 perturbations reaches PF 1.0; the surface is a flat, shallow loss everywhere, with no profitable neighbourhood to migrate toward. Cost and slippage stress only deepen it (PF 0.66–0.80), and the server-clock / DST offsets (−1h / default / +1h) all land net −$1,640 to −$1,808. No knob, cost level, pair or clock rescues it — the ~5-point win-rate deficit is baked into the signal, not reachable by a parameter sweep.
Verdict: REJECT (PF 0.803). Do not deploy. The closest retail miss tested — right structure, positive skew, real trade activity, but a sub-breakeven 41.7% win rate against a ~47.1% gross break-even. Robustly losing in every segment, pair, parameter neighbour, cost level and clock offset. Closing the win-rate gap is a genuine research problem, not a tuning exercise — and nothing in this data suggests the EA’s existing knobs get there.
Charts & evidence
Frequently asked
Why does a trend-pullback EA with positive skew still lose money?
Because the win rate is too low to monetise the skew. The EA shows the right structure — average winner 31.1 pips vs average loser 25.5 pips (1.22×) — but only 15% of trades reach the 2R target while 54% stop out, producing a 41.7% win rate. At that payoff ratio the gross break-even win rate is about 47.1%, so it is roughly 5 points of hit-rate short of viability before costs.
Was the trend-pullback strategy overfit?
No — it is robustly losing. Across 36 parameter perturbations the profit factor stays in a tight 0.79–0.86 band: stable, but stable around a loss. There is no profitable neighbourhood to migrate toward. Closing the ~5-point win-rate gap is a genuine research problem (better regime filter or trade location), not something the EA's existing knobs reach.
Methodology: Independent research screen — the full 11-gate battery was not run; data and execution limits are stated in the report. Full reproducible report: backtests/trendpullback/REPORT.md in the source repository.Author: Validated Research Team (Methodology v1.0 — 11-gate validation). Backtests are not investment advice.