



Gold Momentum
TSM · Time-Series Momentum (XAUUSD)
Time-series (absolute) momentum, 12-month
The most instructive result on the board. It passes 8 of 11 gates — PF 2.41, Sharpe 0.89, cost-robust — but fails the placebo kill-shot: a random long/flat schedule at the same base rate beats it. The "edge" is levered long-gold beta, not momentum. Archetype retired.
- Category
- Momentum
- Window
- 2017-01-02 → 2026-06-19
- Instruments
- XAUUSD (gold)
- Timeframe
- Daily
- Tested
- 2026-06-19
Strategy returns include costs and slippage. Benchmark comparison (vs the category primary and the S&P 500 total return) is backfilling and not shown yet — we don't plot a line we can't source.
How it works
BackfillingThe bet
What market behavior this strategy is wagering on.
Plain-English explainer is backfilling — check back tomorrow. We publish the explanation only once it's written and reviewed, never auto-filled.
How it decides
What makes it enter, size, and exit a position.
Plain-English explainer is backfilling — check back tomorrow. We publish the explanation only once it's written and reviewed, never auto-filled.
How it can break
The regimes and failure modes that turn the edge negative.
Plain-English explainer is backfilling — check back tomorrow. We publish the explanation only once it's written and reviewed, never auto-filled.
Market context
Live chart
Chart powered by TradingView. Live prices can differ from the point-in-time dataset used in the published test.
Gate scorecard — 8 / 11
auto-imported from results.json| # | Gate | Result | Pass |
|---|---|---|---|
| 01 | Minimum sample | 114 trades/periods | ✓ |
| 02 | Profit factor ≥ 1.20 | PF 2.414 | ✓ |
| 03 | Sharpe ≥ 0.6 | Sharpe 0.89 | ✓ |
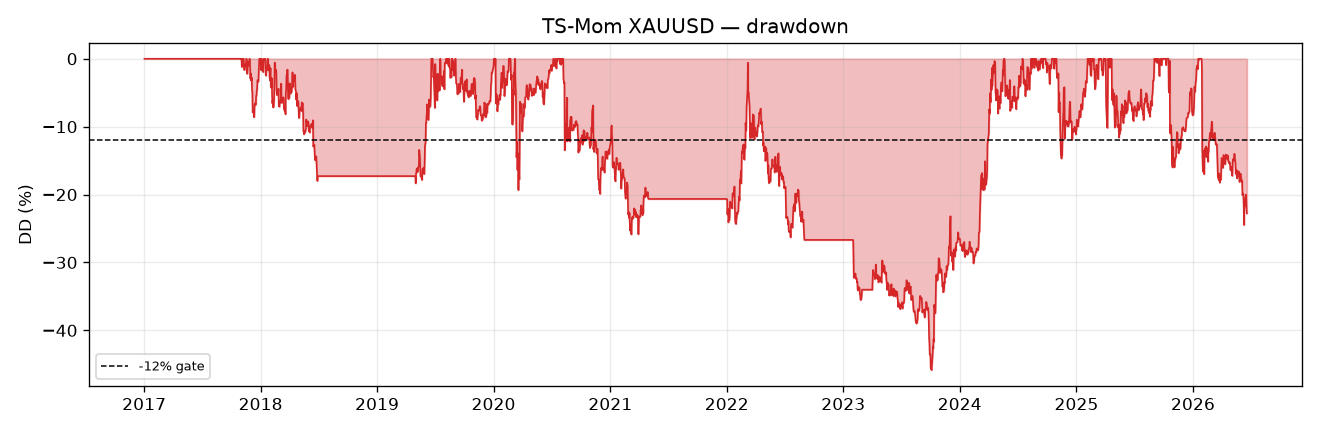
| 04 | Max drawdown ≤ 12% | MaxDD -45.9% | ✗ |
| 05 | Positive ≥ 60% of periods | 70% years positive | ✓ |
| 06 | Bootstrap LB Sharpe > 0 | 95% LB Sharpe 0.32 | ✓ |
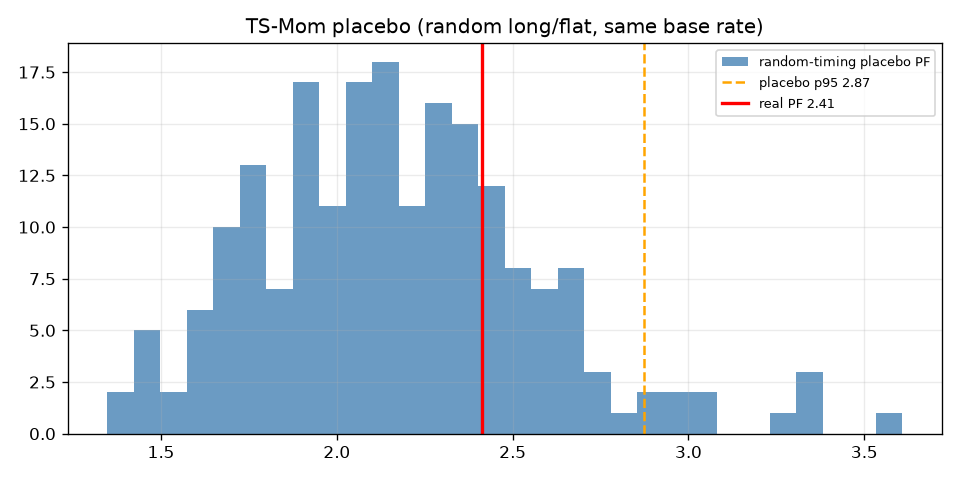
| 07 | Placebo beats p95 | real PF 2.414 vs placebo p95 2.872 | ✗ |
| 08 | 2× cost stress PF > 1.0 | 2x-cost PF 2.400 | ✓ |
| 09 | Deflated Sharpe positive | SR_hat 0.89 vs SR0 0.14, DSR=0.996 | ✓ |
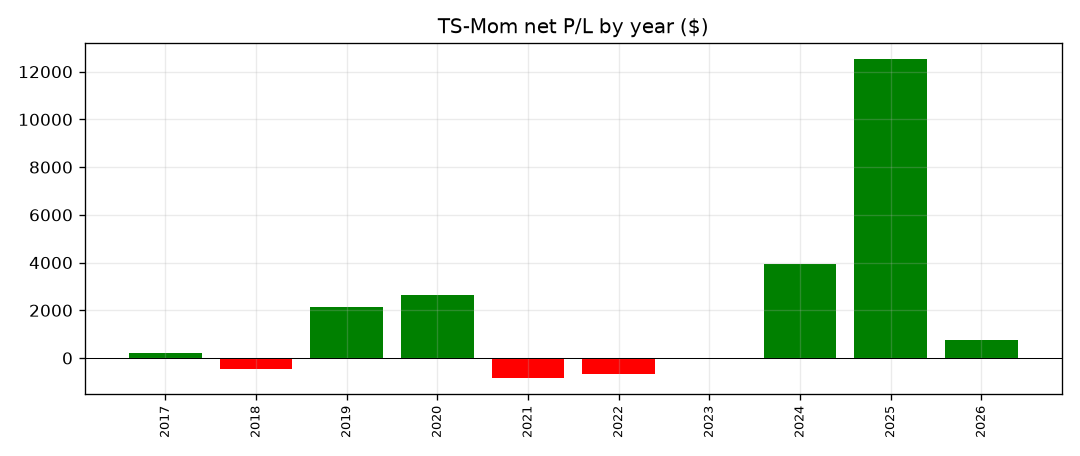
| 10 | No component > 40% | max year share 52% | ✗ |
| 11 | Walk-forward OOS ≥ 0.9× IS | OOS/IS PF 2.87 (IS 1.30, OOS 3.72) | ✓ |
Verdict: RETIRE ARCHETYPE (no v2). Placebo failed — despite 8/11 gates passing.
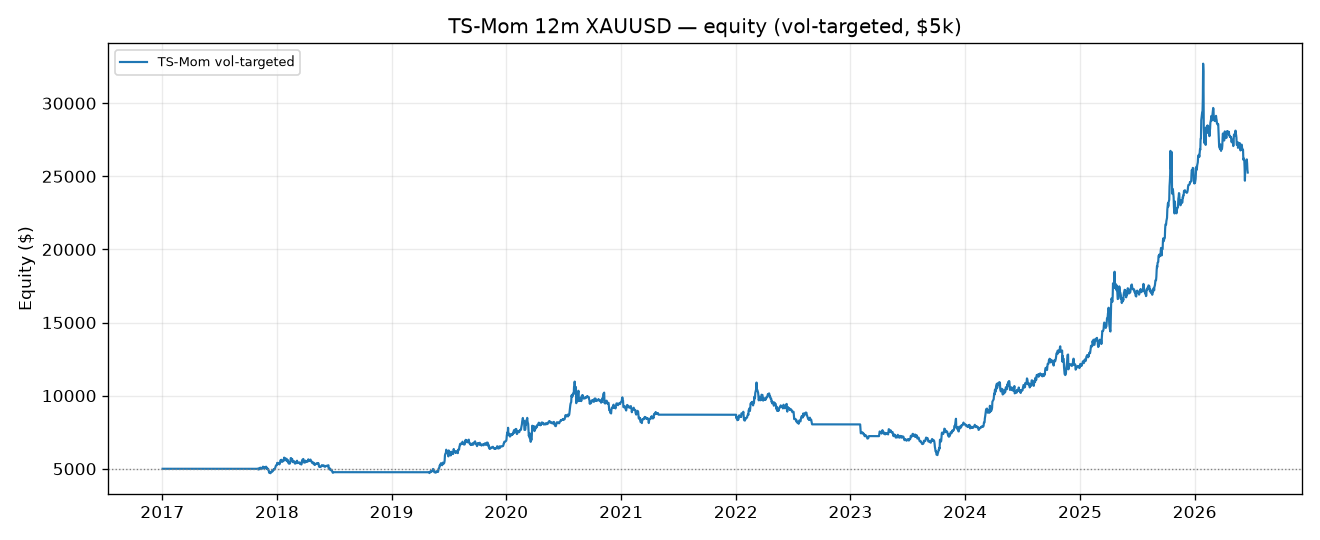
This is the most instructive result of the three. TS-Mom on gold looks excellent on the surface: PF 2.41, Sharpe 0.89, DSR 0.996, cost-robust, 70% of years positive, $5k → $25.3k. It passes 8 of 11 gates. But it fails the placebo kill-shot: a random long/flat schedule at the same 70% base rate produces a PF whose 95th percentile is 2.87 — higher than the strategy’s 2.41 (24% of random schedules beat it outright). The 12-month momentum signal adds no timing value over simply being exposed to gold’s 2017→2026 run. The “edge” is levered long-gold beta, not momentum. Gate 7 is precisely the test that separates the two — and it says beta.
Pre-registration (frozen before results inspected)
- Primary config (gated): 252-trading-day look-back; long if 12m return > 0, else flat (gold rarely shorted); monthly rebalance on the first trading day; position held through the month. Sizing = vol-targeted (Moskowitz/Ooi/Pedersen method): scale = clip(20%/σ̂, 0, 3×), σ̂ = trailing 60d daily-σ × √252, lagged 1d.
- Cost: 3 bps of notional per unit turnover, one-way (gold spread ≈2bps), 2× = 6bps.
- No look-ahead: signal & vol use close through the prior day; positions applied to next-day returns.
- Sensitivity (reported, not gated): vol-targeted vs full-notional. DSR budget
N_TRIALS=2. - Unit for PF / gate-1: monthly P&L (the rebalance unit), mirroring the carry weekly convention. 114 months.
- Gates: standard 11-gate battery (
backtests/_shared/gatelib.py). - Data: Dukascopy spot XAU/USD D1, 2017-01-02 → 2026-06-19 (2,944 bars). Long fraction over the sample = 0.70.
Sensitivity grid
| sizing | final $ | PF (monthly) | max DD |
|---|---|---|---|
| vol-targeted (primary) | 25,259 | 2.414 | −45.9% |
| full-notional 1× | 12,577 | 1.925 | −30.7% |
Both rely on the same long-gold exposure; vol-targeting just adds leverage in calm-trend regimes (and the drawdown to match).
Root cause — why 8 gates pass but the strategy has no edge
Gold rose from ~$1,300 to ~$4,200 over the sample. Any rule that keeps you long ~70% of the time will show a high PF and Sharpe; bootstrap and DSR confirm the return stream is real, and cost-robustness confirms it’s not microstructure. None of those gates can tell beta from alpha — only the placebo can.
The placebo holds the exposure level and frequency fixed and randomises when you are long. If momentum timing mattered, the real rule would beat random scheduling. It does not — random does better at the 95th percentile. The 252d filter is not selecting good months; it is just a slightly-worse-than-random way to stay long a bull market. Concentration confirms the source: 52% of all P/L is the single 2025 gold surge (g10 fail), and the −46% drawdown (g4 fail) is gold’s own, not a strategy’s risk control.
Decision
Per the pre-registered rule: placebo failed → RETIRE ARCHETYPE, no v2. We will not “fix” it with a short leg, a trend filter, or multi-asset diversification — those are different archetypes, not rescues of this one. Single-asset gold TS-Mom is closed.
Lesson (worth keeping): PF 2.4 / Sharpe 0.89 / DSR 0.996 and still no edge. The placebo gate is the only one of the eleven that caught it. This is the strongest single demonstration in the program of why gate 7 is non-negotiable.
Charts
charts/equity_curve.png— equity to $25k (all beta)charts/drawdown.png— −46% drawdown vs −12% gatecharts/placebo.png— real PF left of the random-timing p95 (the finding)charts/yearly_pnl.png— 2025 dominates
Artifacts: results.json, run.py.
Equity curve
Growth of $5,000, cost-inclusive. Coded from the committed backtest series — not an image. Agents: GET /api/v1/strategy/TSM/equity
Charts & evidence
Frequently asked
Is Time-Series Momentum profitable in 2026?
In this pre-registered backtest (2017-01-02 → 2026-06-19), Time-Series Momentum (XAUUSD) returned a profit factor of 2.41 and passed 8/11 validation gates (placebo FAIL). Verdict: RETIRED. Every result is published, pass or fail.
Has Time-Series Momentum been backtested honestly?
Yes — through The Validation Gauntlet, a pre-registered 11-gate framework (profit factor, deflated Sharpe, a random-permutation placebo, cost-stress and walk-forward) with the specification locked before any out-of-sample metric is computed. It failed and is published anyway.
Methodology: 11-gate validation — pre-registered spec, 11-gate battery, real market data. Full reproducible report: backtests/tsmom_xauusd/REPORT.md in the source repository.Author: Validated Research Team (Methodology v1.0 — 11-gate validation). Backtests are not investment advice.