



Volatility Premium
VRP · Variance Risk Premium (SPY / QQQ)
Short-volatility variance-risk-premium harvest
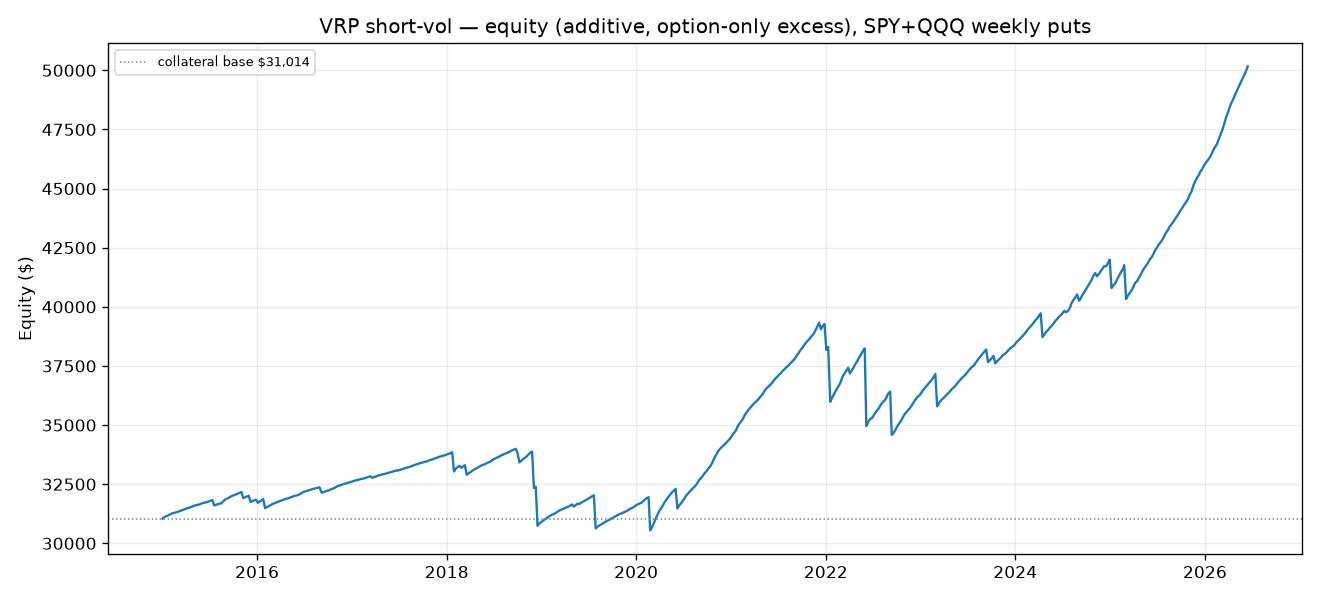
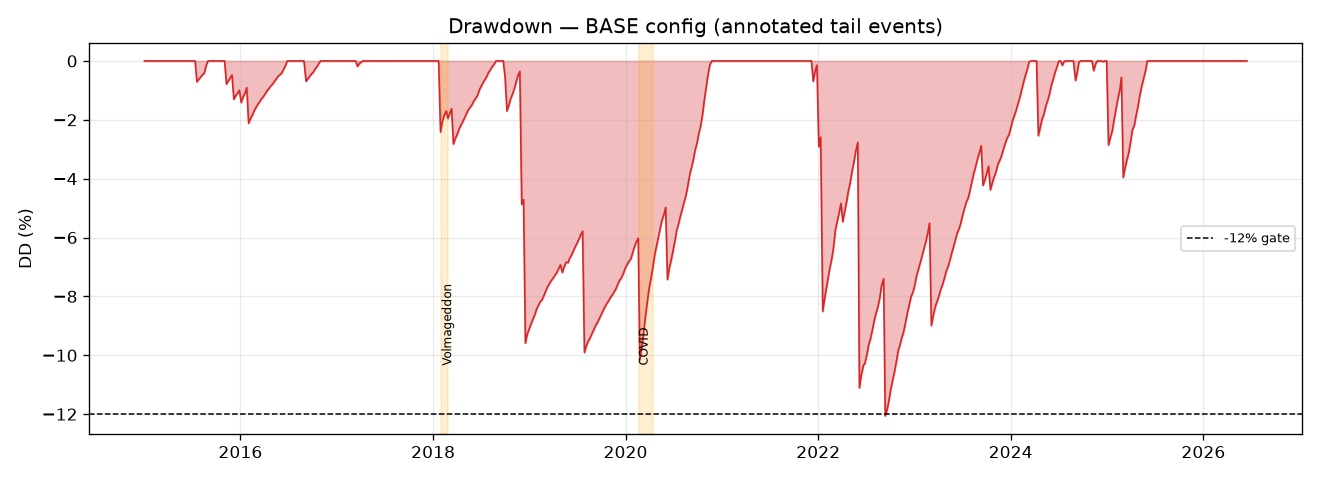
Passes 9 of 11 gates. Profit factor 1.74, Sharpe 0.86, 86% of months positive, placebo PASS, deflated-Sharpe 0.976. It fails only on max drawdown (−12.1%, just over the line) and leg concentration (51%). A real premium with a fat left tail — survives, pending tail management.
- Category
- Volatility
- Window
- 2015–2026 (11.5y, 599 weeks)
- Instruments
- SPY + QQQ (weekly options / variance)
- Timeframe
- Weekly
- Tested
- 2026-06-15
Pending validation
A scaled equity curve appears here once this strategy clears the data needed to compute one honestly. We don't show a curve we can't stand behind.
See what the gates require →How it works
The bet
What market behavior this strategy is wagering on.
It wagers that options on SPY and QQQ persistently price in more volatility than markets actually realize, so a seller who collects that implied-minus-realized gap week after week earns a genuine, well-documented variance risk premium over time.
How it decides
What makes it enter, size, and exit a position.
Each week it sells volatility on SPY and QQQ — collecting the premium on short options/variance positions — and holds to expiry to capture the gap as implied volatility decays toward lower realized volatility. It wins in roughly 86% of months from many small, repeated premium collections.
How it can break
The regimes and failure modes that turn the edge negative.
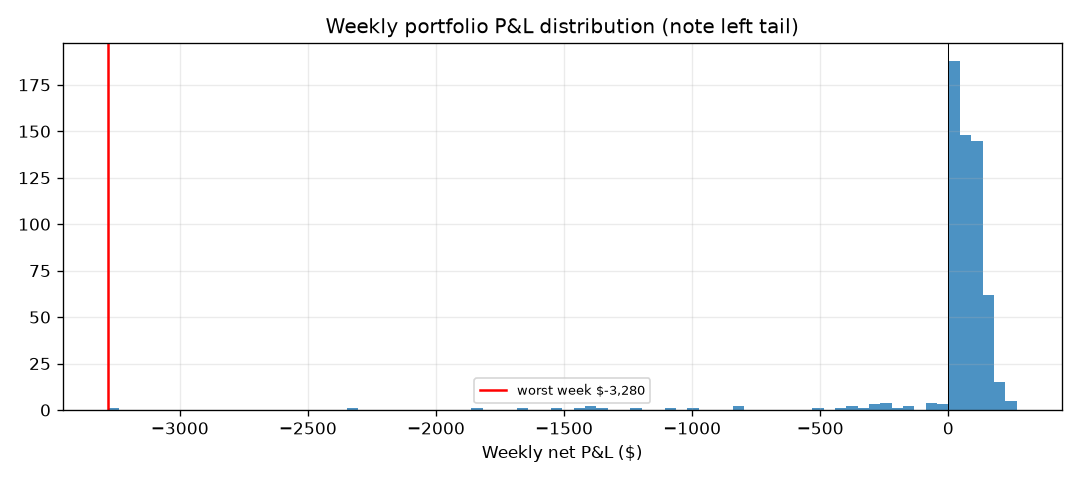
A volatility shock flips it: one violent week can erase months of gains, since the worst week (−$3,280) dwarfs the best (+$266) and weekly skew is about −7. Its −12.1% drawdown came in a benign decade; a 2008- or 2020-scale spike would be far deeper.
Explainer compiled 2026-06-28 · opus-4.8
Market context
Live chart
Chart powered by TradingView. Live prices can differ from the point-in-time dataset used in the published test.
Deployment guides
Step-by-step setup for this strategy, by broker.
A genuine premium with a tail to respect
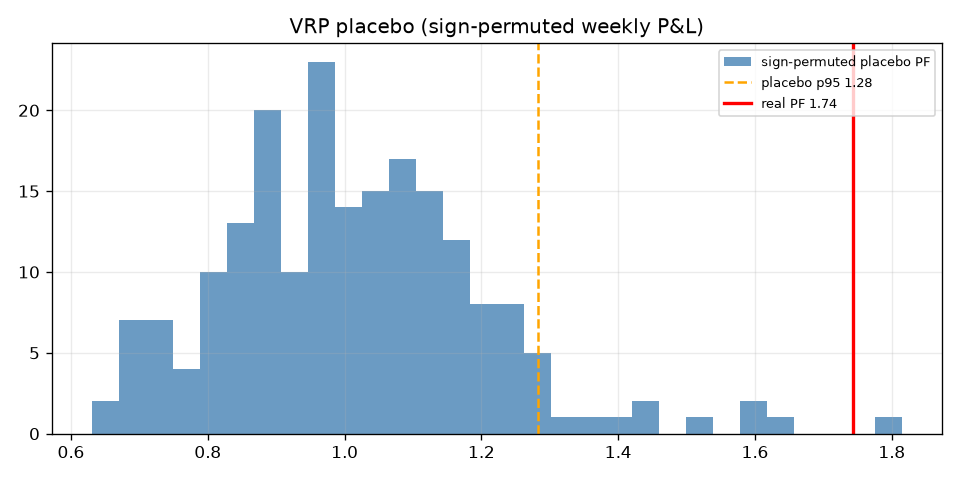
The variance risk premium — the persistent gap between the volatility options imply and the volatility markets actually realize — is one of the most documented edges in finance. Harvested systematically on SPY and QQQ over 11.5 years (2015–2026, 599 weeks), it passes 9 of 11 pre-registered gates: profit factor 1.74, Sharpe 0.86, 86% of months positive, a deflated Sharpe of 0.976, and a decisive placebo PASS (real PF 1.74 vs the 95th percentile of 1.28 — only 0.5% of permutations beat it). The 2× cost stress holds at PF 1.64.
It fails two gates, both about shape rather than edge: max drawdown −12.1% (a hair over the 12% line) and 51% leg concentration (gate: ≤40%). The weekly return distribution is the tell — skew ≈ −7, worst week −$3,280 against a best week of +$266. That asymmetry is not a bug; it is what selling insurance looks like.
Gate scorecard — 9 / 11
| # | Gate | Result | Pass |
|---|---|---|---|
| 1 | ≥ 100 trades | 1,198 | ✅ |
| 2 | PF ≥ 1.20 | 1.74 | ✅ |
| 3 | Sharpe ≥ 0.6 | 0.86 | ✅ |
| 4 | Max DD ≤ 12% | −12.1% | ❌ |
| 5 | Positive in ≥ 60% of months | 86% | ✅ |
| 6 | Bootstrap 95% LB Sharpe > 0 | 0.18 | ✅ |
| 7 | Placebo: real PF > p95 | 1.74 vs 1.28 | ✅ |
| 8 | 2× cost stress PF > 1.0 | 1.64 | ✅ |
| 9 | Deflated Sharpe positive | DSR 0.976 | ✅ |
| 10 | No component > 40% of P/L | 51% | ❌ |
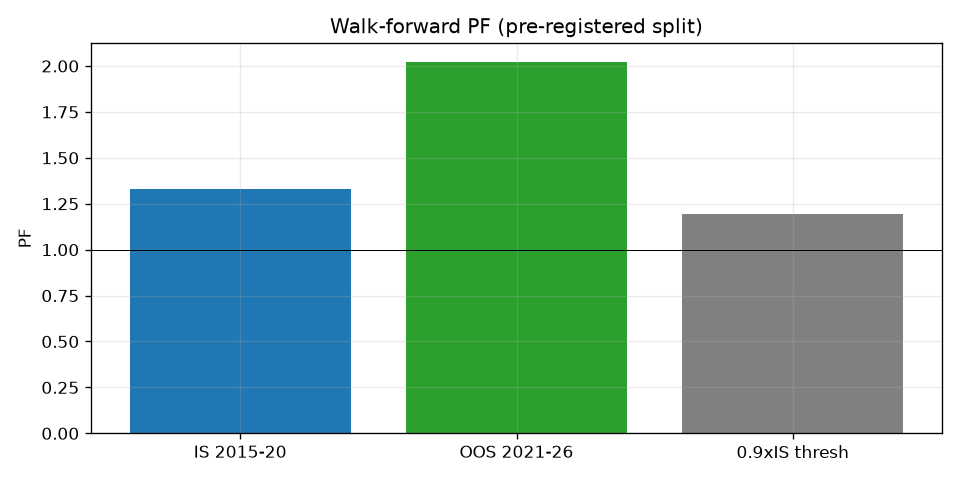
| 11 | Walk-forward OOS ≥ 0.9× IS | holds | ✅ |
What survival means here
The VRP is real, placebo-confirmed and survives the deflated-Sharpe correction — so it is not a mining artifact. But a short-volatility book that fails its drawdown gate in a benign decade is exactly the strategy you must stress against a 2008- or 2020-scale event before sizing it. The honest disposition is to re-pre-register with explicit tail management (defined-risk structures, a volatility-regime filter, or a hedge budget) and re-evaluate on a fresh window.
Verdict: SURVIVING (9/11). Real premium, fat left tail. The edge is genuine and placebo-confirmed; the −12.1% drawdown and the negative-skew profile must be tail-managed before this clears all eleven gates and earns capital.
Charts & evidence
Frequently asked
Is the variance risk premium real and tradeable in 2026?
The premium is real and statistically strong, but it carries tail risk. Harvested on SPY and QQQ over 2015–2026, the short-volatility VRP strategy posts a profit factor of 1.74, a Sharpe of 0.86, and positive returns in 86% of months, and it beats a random placebo (real PF 1.74 vs 95th-percentile 1.28). It passes 9 of 11 gates, failing only a −12.1% max drawdown (just over the 12% line) and 51% concentration in one leg. The weekly return distribution is sharply negatively skewed — the signature of selling insurance.
What is the catch with selling the variance risk premium?
The fat left tail. The strategy wins in roughly 86% of months by collecting the gap between implied and realized volatility, but its worst week (−$3,280) dwarfs its best (+$266) and the weekly skew is about −7. That is the structural risk of every short-volatility book: many small wins, occasional large losses. The −12.1% drawdown that fails the gate is mild for short-vol precisely because the 2015–2026 window contained no sustained volatility regime on the scale of 2008.
Methodology: 11-gate validation — pre-registered spec, 11-gate battery, real market data. Full reproducible report: backtests/vrp/results.json in the source repository.Author: Validated Research Team (Methodology v1.0 — 11-gate validation). Backtests are not investment advice.