



Daily Trend Follower
DTF · D1 Trend-Following (50/200 SMA)
Daily moving-average crossover, 8 majors + gold
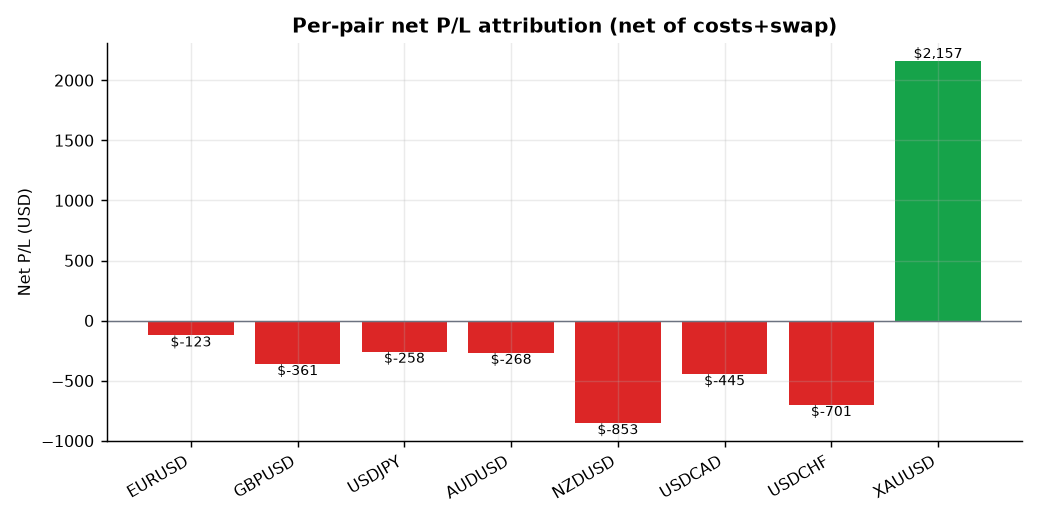
Only gold made money (+$2,157); all seven FX majors lost. FX majors ranged rather than trended in 2018–2026, so a trend system had nothing to capture. Every parameter pair lands PF 0.91–0.99 and both out-of-sample halves lose — structural, not cost.
- Category
- Trend
- Window
- 2018–2026 (8.5y)
- Instruments
- EURUSD, GBPUSD, USDJPY, AUDUSD, NZDUSD, USDCAD, USDCHF, XAUUSD
- Timeframe
- Daily (D1)
- Tested
- 2026-06-20
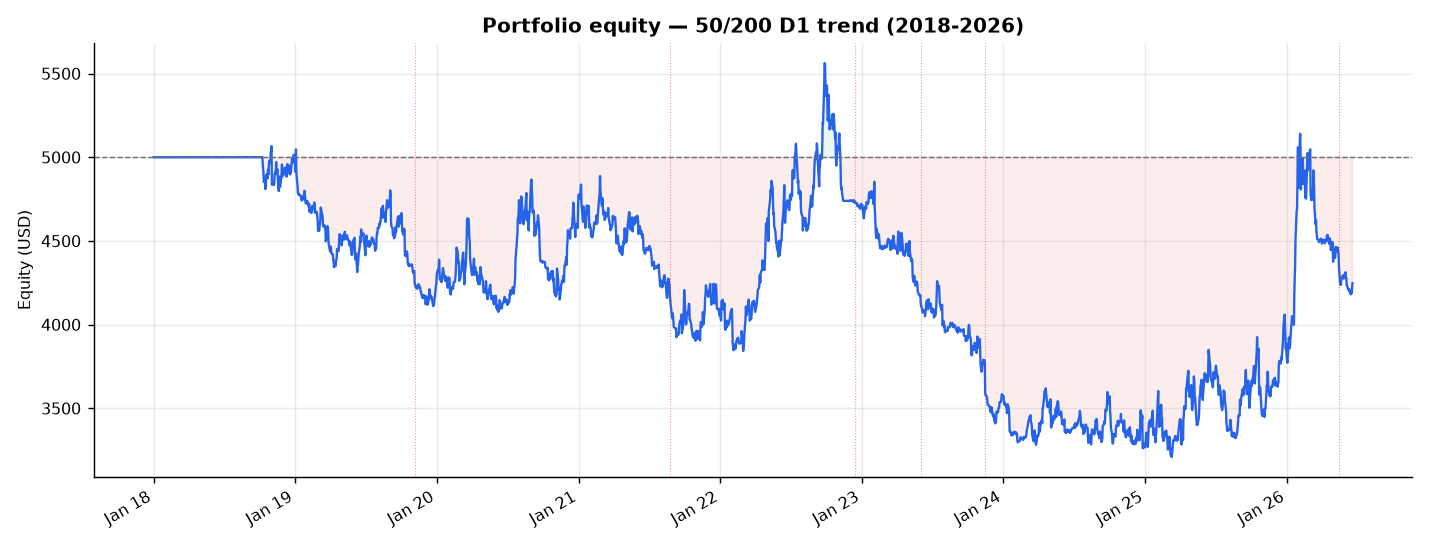
Measured equity history
Recorded directly from the chronological test ledger.
Shown in the backtest's native equity or cumulative P&L units. It is not scaled to an investment amount because the published artifact does not provide a defensible capital denominator.
How it works
The bet
What market behavior this strategy is wagering on.
It wagers that FX majors and gold form persistent multi-month trends a slow moving-average crossover can ride, accepting many small losers in exchange for a few large winners that more than pay for them.
How it decides
What makes it enter, size, and exit a position.
It goes long when the 50-day SMA crosses above the 200-day and short when it crosses below, holding each daily position until the averages cross back the other way, with an ATR-based stop bounding individual losses.
How it can break
The regimes and failure modes that turn the edge negative.
It turns negative in range-bound, mean-reverting regimes where prices oscillate without sustained direction, as the FX majors did in 2018–2026: repeated false crossovers bleed whipsaw losses and spread while no trend large enough to recover them ever arrives.
Explainer compiled 2026-06-28 · opus-4.8
Market context
Live chart
Chart powered by TradingView. Live prices can differ from the point-in-time dataset used in the published test.
The story in one line
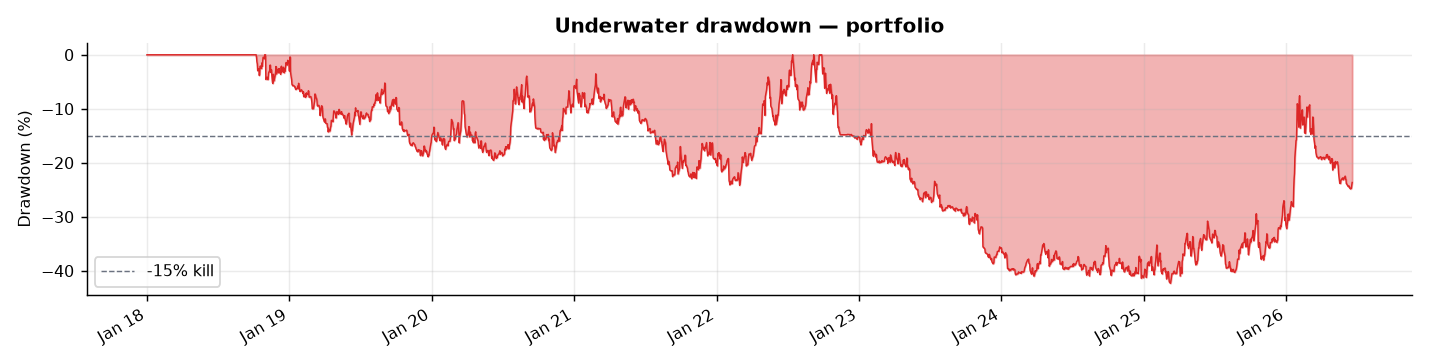
The classic 50/200-day SMA crossover on eight FX majors plus gold, run honestly on real 2018–2026 data, loses money: the account ends at $4,251 (−15% over 8.5 years) with a −42.3% max drawdown, net profit factor 0.94, Sharpe −0.02, win rate 36.7% across 934 trades. That is below the PF > 1.2 deployment bar by a wide margin.
The cause is structural, not cost-related: of the eight instruments, only gold (XAUUSD) made money (+$2,157). All seven FX majors lost. The majors ranged rather than trended during 2018–2026, so a trend-following system has nothing to capture and bleeds whipsaw plus spread. The historical trend edge in this basket now lives almost entirely in gold — and one instrument carrying a portfolio is the opposite of robust.
This is the third archetype to fail the bar (basket-grid PF 0.51; Fury/CORE PF 0.73–0.90 net; trend-D1 PF 0.94). The consistent lesson: simple published edges, costed honestly on the major-FX basket, do not clear PF 1.2. Trend-D1 retired.
Per-pair attribution
Gold is the only green bar. Strip it and the seven-pair FX book loses ~$3,000 (−60% of capital) on its own.
| Pair | Net P/L | of which swap | Trades | Win rate |
|---|---|---|---|---|
| XAUUSD | +$2,157 | −$389 | 112 | 43% |
| EURUSD | −$123 | −$36 | 105 | 39% |
| USDJPY | −$258 | +$8 | 113 | 36% |
| AUDUSD | −$268 | −$37 | 132 | 39% |
| GBPUSD | −$361 | −$56 | 116 | 34% |
| USDCAD | −$445 | −$92 | 125 | 42% |
| USDCHF | −$701 | −$132 | 120 | 30% |
| NZDUSD | −$853 | −$55 | 111 | 30% |
A 36.7% win rate is normal for trend-following — a few big winners pay for many small losers. The problem is the winners weren’t big enough: gross profit $12.9k vs gross loss $13.7k. Gold’s secular uptrend (≈$1,300 → ≈$3,300/oz) is the entire edge.
Parameter-robustness sweep
If an edge is fragile to small crossover changes, it’s overfit. Here the opposite is true — the strategy is robustly absent. Nothing clears 1.0, let alone 1.2, and there is no parameter island of profitability to overfit to.
| Crossover | PF | Sharpe | CAGR | Max DD | Trades |
|---|---|---|---|---|---|
| 50 / 200 (spec) | 0.94 | −0.02 | −1.9% | −42.3% | 934 |
| 100 / 200 | 0.95 | 0.01 | −1.3% | −30.5% | 745 |
| 50 / 100 | 0.99 | 0.13 | +0.8% | −50.2% | 1030 |
| 20 / 100 | 0.91 | −0.04 | −2.7% | −51.3% | 1354 |
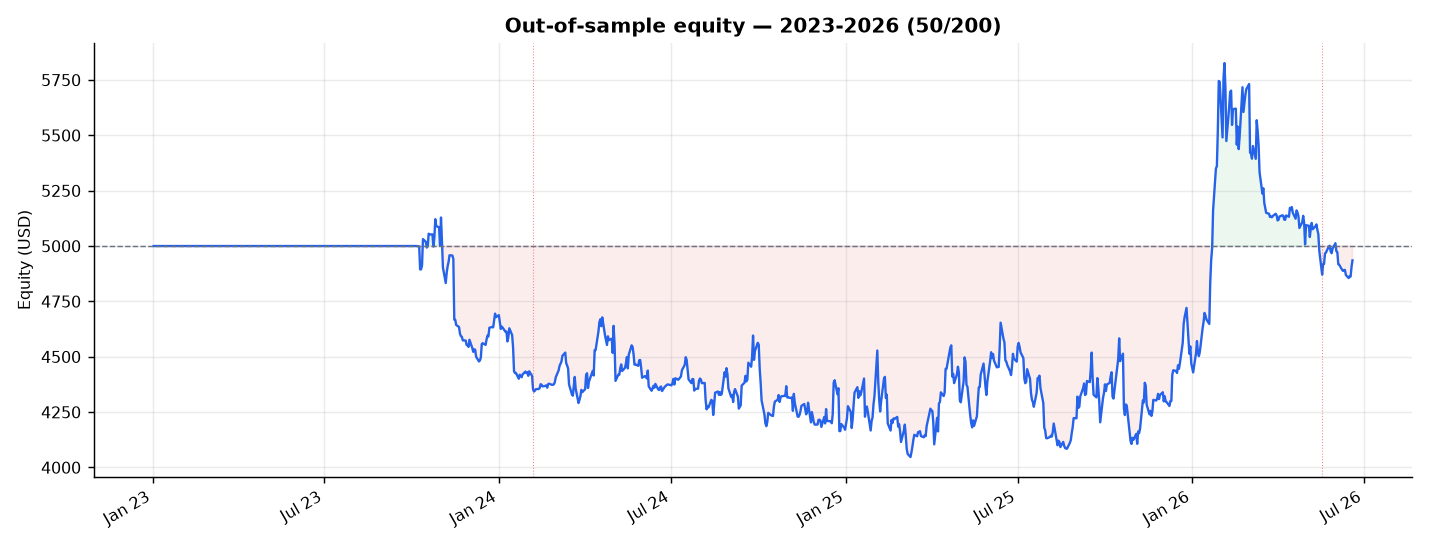
Both out-of-sample halves also lose independently: train 2018–2022 PF 0.96, validate 2023–2026 PF 0.97. There is no regime in the 8.5-year span where the literal spec produced a positive PF.
Structural, not cost
To separate implementation from premise, the canonical golden/death-cross variant — always in-market, hold until the cross flips, stops removed — was tested as the most charitable, textbook implementation. Multi-month holds, no whipsaw, no stop-churn: it reaches PF 1.01 in-sample (break-even) with a 129-day median hold — recovering ~7 PF points by killing whipsaw and the −3 ATR stops. But it collapses to PF 0.72 / Sharpe −0.37 out-of-sample (2023–2026). Even its in-sample break-even is entirely gold (+$2,679) papering over NZD −$1,027 and CHF −$1,210.
The diagnosis: better implementation confirms the literal rule does leak value to whipsaw and stops — but fixing all of that still leaves a strategy that only breaks even in-sample and loses out-of-sample, because the underlying premise — that the 8 majors trend — was false for this decade. Costs make a structurally edgeless strategy worse; they are not the reason it has no edge.
Verdict: FAIL (PF 0.94). Do not deploy. Don’t run 50/200 (or any tested variant) on the 8-major basket — it loses across every cut. The only signal worth a follow-up is that daily trend-following on gold carried real edge here, but that is one instrument, not a portfolio, and out of scope for “forex.” The transferable lesson: pivot the instrument set (FX majors are efficient and range-bound), not the signal.
Charts & evidence
Frequently asked
Does 50/200 SMA trend-following work on forex majors?
Not in 2018–2026. The classic 50/200-day crossover on eight FX majors plus gold returned a net profit factor of 0.94, a Sharpe of −0.02, and a −42% max drawdown. Of the eight instruments only gold made money (+$2,157); all seven FX majors lost. The majors ranged rather than trended, so a trend-following system had nothing to capture and bled whipsaw plus spread.
Is the trend-following loss caused by costs or by the strategy?
Structural, not cost. Every parameter pair tested (50/200, 100/200, 50/100, 20/100) lands at PF 0.91–0.99, and both out-of-sample halves lose money. Even the most charitable textbook implementation (multi-month holds, no stop-churn) only reaches break-even in-sample and collapses to PF 0.72 out-of-sample — because the underlying premise, that the majors trend, was false for this decade.
Methodology: Independent research screen — the full 11-gate battery was not run; data and execution limits are stated in the report. Full reproducible report: backtests/trend/REPORT.md in the source repository.Author: Validated Research Team (Methodology v1.0 — 11-gate validation). Backtests are not investment advice.