



Overnight Mean Reversion
NMR · NightMeanRevert EA
Bollinger-band night session mean-reversion
A disciplined, well-built clean-room EA with no edge. Fails 4 of 6 acceptance gates and misses the ≥200-trade prerequisite by ~8×. Price reverts to the band-center target only 21% of the time and stops out 66% — the mean-reversion thesis simply does not hold in the night window.
- Category
- Mean-reversion
- Window
- 2018–2026 (8.5y)
- Instruments
- EURUSD, GBPUSD, USDJPY, AUDUSD
- Timeframe
- M5 (night session)
- Tested
- 2026-06-20
Pending validation
A scaled equity curve appears here once this strategy clears the data needed to compute one honestly. We don't show a curve we can't stand behind.
See what the gates require →How it works
The bet
What market behavior this strategy is wagering on.
It wagers that during the quiet overnight session, when volatility and trend are low, price stretched outside its Bollinger bands is an overreaction that snaps back toward the band center rather than continuing to run.
How it decides
What makes it enter, size, and exit a position.
During the 3-hour night window it waits for price to reject a Bollinger band in a low-volatility, low-trend regime, enters a fixed 0.25%-risk reversion trade, targets the band center, and stops out at 1.40 times ATR.
How it can break
The regimes and failure modes that turn the edge negative.
The edge turns negative whenever the night-window stretch keeps running instead of reverting: price reaches the center target only 21% of the time and stops out 66%, so the 29.6% win rate falls far below the 39.1% needed to break even.
Explainer compiled 2026-06-28 · opus-4.8
Market context
Live chart
Chart powered by TradingView. Live prices can differ from the point-in-time dataset used in the published test.
The story in one line
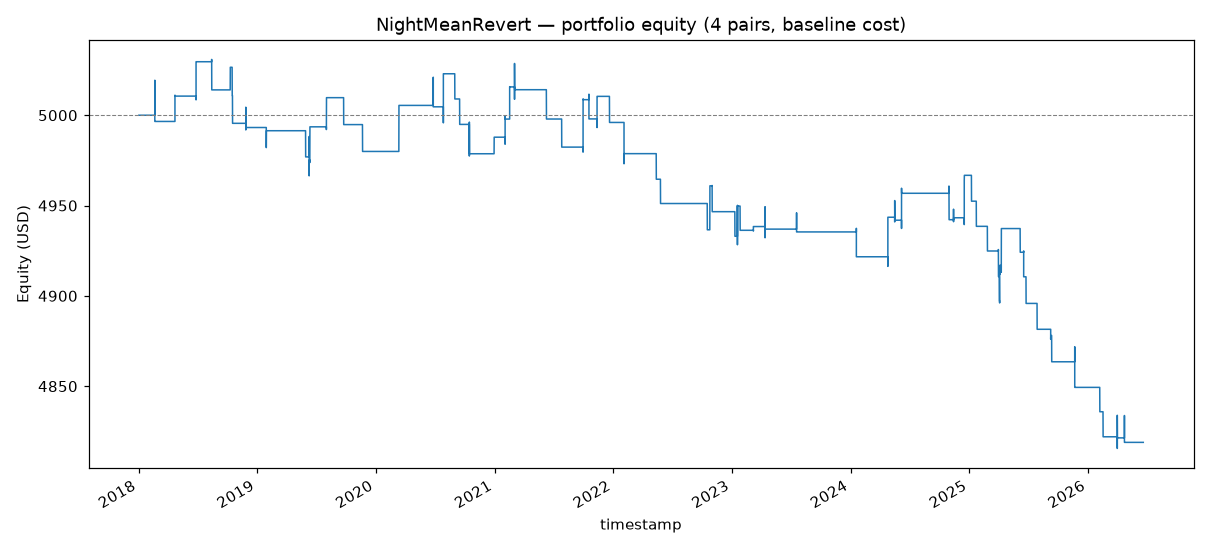
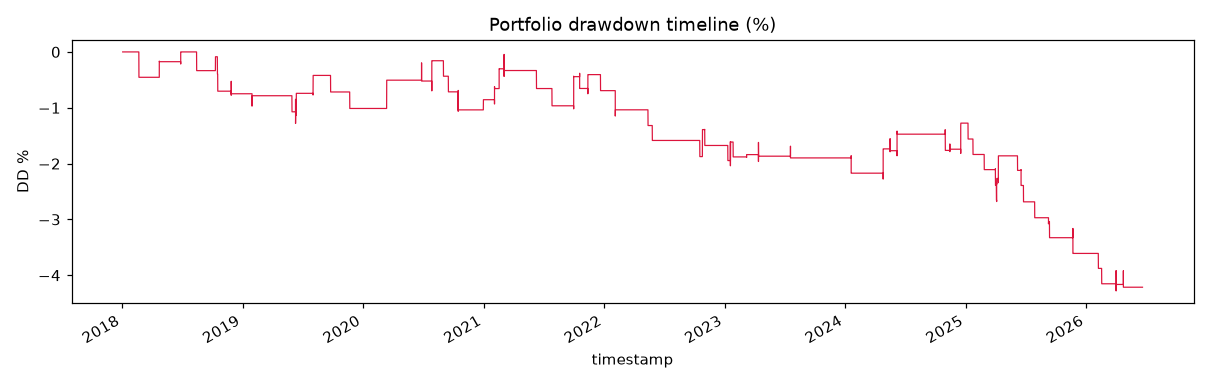
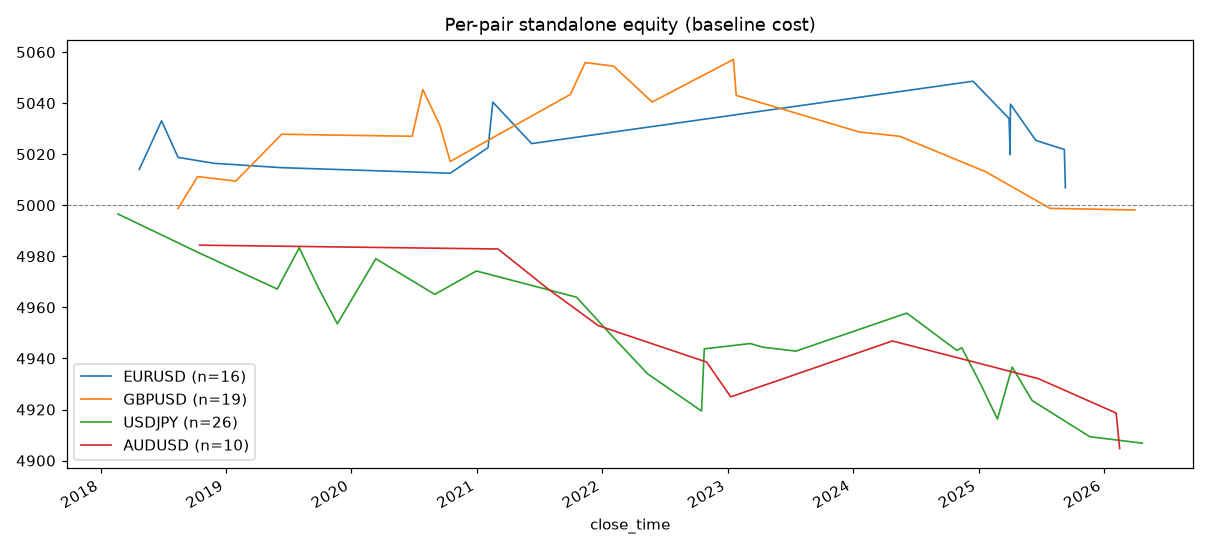
A clean-room, 985-line MQL5 night-session mean-reversion EA — Bollinger-band rejection in low-vol, low-trend regimes, with genuinely well-built risk controls — loses money on real 2018–2026 Dukascopy M5 data: net −$181 (−3.62%), profit factor 0.655, Sharpe −0.48, win rate 29.6% across 71 trades. It is net-negative in every out-of-sample segment, and every single parameter perturbation tested is break-even at best. This is not a cost problem or a tuning problem — the mean-reversion edge is absent in the data.
This is the opposite failure mode of the basket-grid bots that over-traded into ruin: NightMeanRevert is so selective it produces only ~8 trades/year across 4 pairs, and the few it takes lose. The 4th archetype to fail — and the most disciplined of them.
Headline result
| Metric | Value |
|---|---|
| Profit factor | 0.655 |
| Win rate | 29.6% |
| Net P&L | −$181 (−3.62%) |
| Trades (8.5y, 4 pairs) | 71 (8.4/yr) |
| Reverts to target | 21% (15/71) |
| Stops out | 66% (47/71) |
The realised reward:risk is a healthy 1.56, but a 29.6% win rate needs to be ≥39.1% to break even. It isn’t. Price reaches the BB-center target only 21% of the time and hits the 1.40-ATR stop 66% of the time — the mean-reversion thesis does not hold within the 3-hour night window.
Per-segment performance
| Segment | n | PF | Win% | Net $ | Positive? |
|---|---|---|---|---|---|
| Dev 2018–2021 | 33 | 0.98 | 36.4 | −4.01 | ❌ |
| Validation 2022–2023 | 13 | 0.42 | 23.1 | −60.61 | ❌ |
| Locked OOS 2024–Jun 2026 | 25 | 0.47 | 24.0 | −116.50 | ❌ |
Every segment is negative. The dev period is the “least bad” (a statistical zero on n=33), and performance degrades out-of-sample — the opposite of a robust edge. The README required ≥200 OOS trades; the locked OOS produced 25, an 8× miss, leaving the strategy statistically un-validatable.
No profitable island
A one-at-a-time parameter sweep finds no profitable neighbourhood. The best result anywhere in the grid is short_rsi_min=75 at PF 1.001 (dead flat, no net trades) and bands_period=15 at PF 0.984 — the least-bad perturbations are break-even at best, and they straddle a negative default rather than sitting on a robust plateau. Every other cell lands at PF 0.25–0.72. Loosening filters to get more trades (long_rsi_max=45 → n=181) makes it worse (−7.49%). DST/server-clock offsets (−1h / default / +1h) all lose (−$407 / −$181 / −$151). The “tunings” that nudge PF toward 1.0 do so by removing losing trades until nothing is left — converging to no-trade, not to a profitable system. This is the signature of no edge, not overfitting.
Verdict: REJECT (PF 0.655). Do not deploy. NightMeanRevert is the most disciplined of the failed retail EAs — the clean-room engineering is sound and the risk controls are genuinely well-built — but the signal those controls gate has no demonstrable edge on real data. A backtest that loses before any live frictions (real night spreads, swap, tick-fill slippage) are added will only lose more with them.
Charts & evidence
Frequently asked
Does Bollinger-band night mean-reversion work in forex?
Not in this clean-room test. A Bollinger-band night-session mean-reversion EA backtested on real 2018–2026 M5 data returned a profit factor of 0.655 and was net-negative in every out-of-sample segment. Price reverted to the band-center target only 21% of the time while stopping out 66% of the time; a 29.6% win rate needs to be at least 39.1% just to break even.
Could parameter tuning rescue the night mean-reversion EA?
No. Every one-at-a-time parameter perturbation was break-even at best (the least-bad reached PF 1.001 with no trades), and loosening filters to get more trades made it worse. There is no profitable parameter island — the signature of no edge rather than overfitting. It also failed the ≥200-OOS-trade prerequisite by about 8×, producing only ~8 trades per year across four pairs.
Methodology: Independent research screen — the full 11-gate battery was not run; data and execution limits are stated in the report. Full reproducible report: backtests/nightmr/REPORT.md in the source repository.Author: Validated Research Team (Methodology v1.0 — 11-gate validation). Backtests are not investment advice.