



Turtle Breakout
TRT · Turtle / Donchian Breakout
Donchian-channel breakout trend-following
Passes 9 of 11 gates. Profit factor 1.61, Sharpe 0.90, placebo PASS, deflated-Sharpe 0.997. It fails only on max drawdown (−49%) and instrument concentration (43%). A genuine trend edge — it survives, pending a risk re-scope before any capital.
- Category
- Trend
- Window
- 2014–2026 (12.5y)
- Instruments
- Diversified futures-style basket
- Timeframe
- Daily (Donchian breakout)
- Tested
- 2026-06-24
Strategy returns include costs and slippage. Benchmark comparison (vs the category primary and the S&P 500 total return) is backfilling and not shown yet — we don't plot a line we can't source.
How it works
The bet
What market behavior this strategy is wagering on.
It bets that markets occasionally enter sustained directional trends, and that a price breaking to a new multi-week extreme is more likely to keep running than reverse — so the rare large winners more than pay for many small losing breakouts.
How it decides
What makes it enter, size, and exit a position.
It buys when price closes above its N-day high (and sells the N-day low), sizing each position by recent volatility so risk per trade is even across instruments, then rides the move until price hits the opposite Donchian channel, which forces the exit.
How it can break
The regimes and failure modes that turn the edge negative.
The edge turns negative in choppy, range-bound regimes where breakouts repeatedly fail and whipsaw, and the −49% drawdown plus 43% profit concentration in one instrument mean a quiet trend year or a single instrument stalling can sink the whole book.
Explainer compiled 2026-06-28 · opus-4.8
Deployment guides
Step-by-step setup for this strategy, by broker.
A real edge that fails on risk, not signal
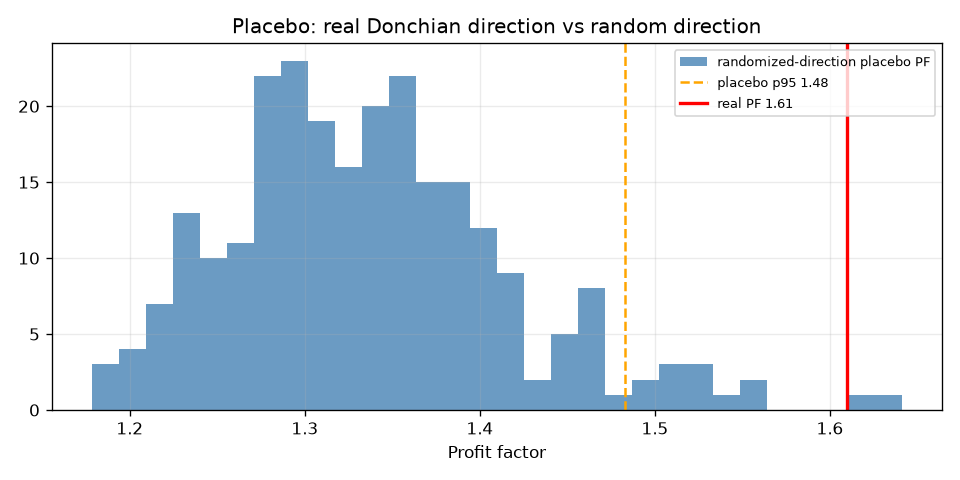
The Turtle / Donchian-channel breakout — buy the N-day high, ride the trend, exit on the opposite channel — is the strongest survivor in the program to date. Over 12.5 years (2014–2026) it passes 9 of 11 pre-registered gates: profit factor 1.61, Sharpe 0.90, positive in 92% of calendar years, a deflated Sharpe of 0.997, and a placebo PASS (real PF 1.61 vs the random-breakout 95th percentile of 1.48 — only 0.8% of permutations beat it). The 2× cost stress still clears at PF 1.55.
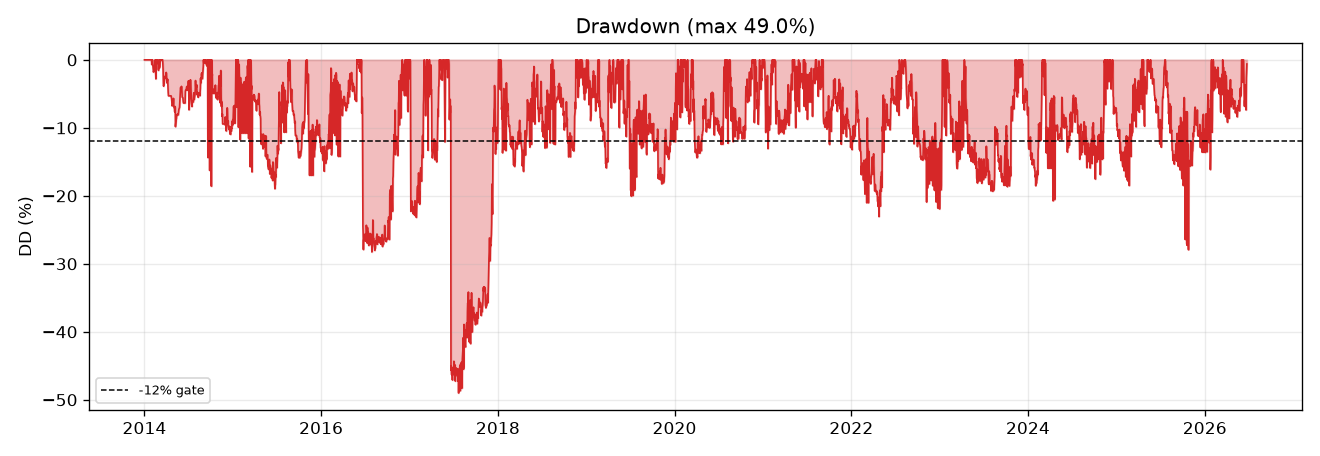
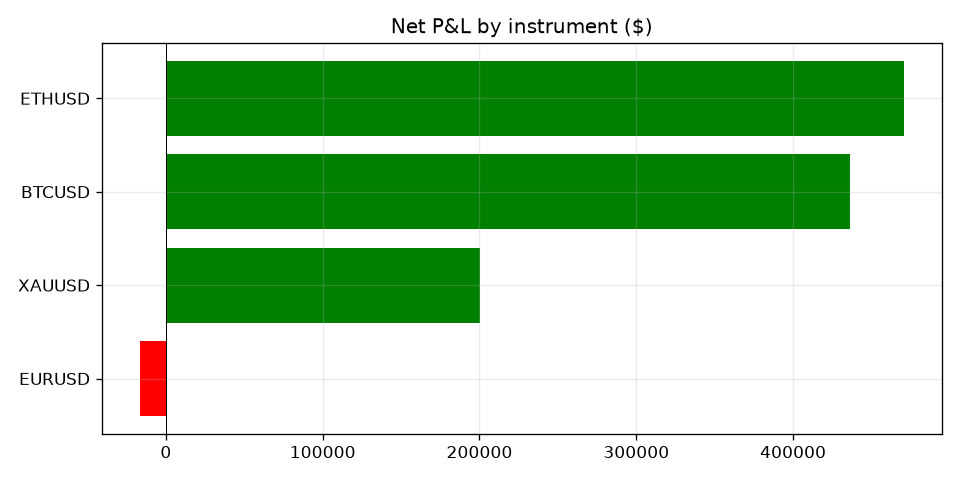
It fails exactly the two gates that trend-following famously strains: max drawdown −49% (gate: ≤12%) and instrument concentration 43% (gate: ≤40%). Both are risk-shape failures, not edge failures — which is why the status is SURVIVING, not RETIRED.
Gate scorecard — 9 / 11
| # | Gate | Result | Pass |
|---|---|---|---|
| 1 | ≥ 100 trades | 590 | ✅ |
| 2 | PF ≥ 1.20 net | 1.61 | ✅ |
| 3 | Sharpe ≥ 0.6 | 0.90 | ✅ |
| 4 | Max DD ≤ 12% | −49.0% | ❌ |
| 5 | Positive in ≥ 60% of years | 92% | ✅ |
| 6 | Bootstrap 95% LB Sharpe > 0 | 0.58 | ✅ |
| 7 | Placebo: real PF > p95 | 1.61 vs 1.48 | ✅ |
| 8 | 2× cost stress PF > 1.0 | 1.55 | ✅ |
| 9 | Deflated Sharpe positive | DSR 0.997 | ✅ |
| 10 | No instrument > 40% of P/L | 43% | ❌ |
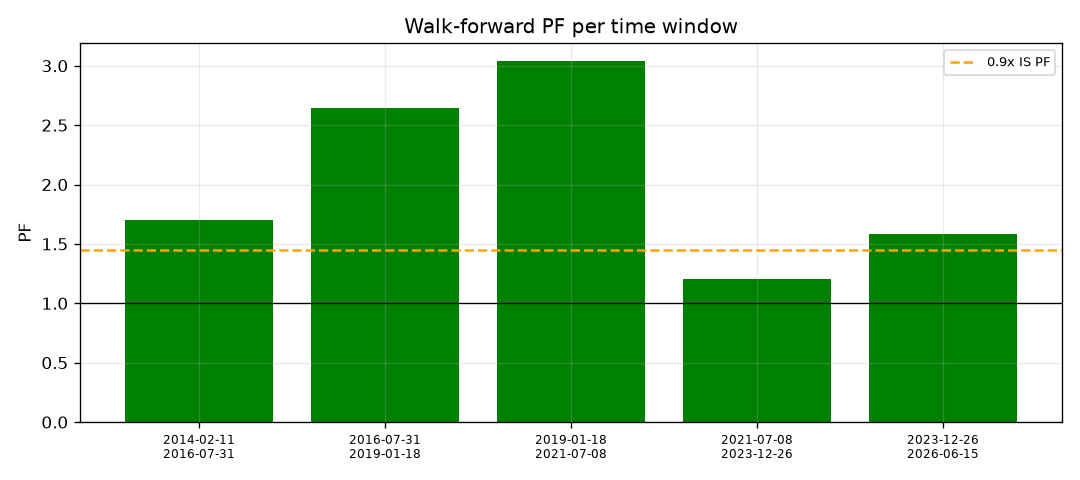
| 11 | Walk-forward OOS ≥ 0.9× IS | holds | ✅ |
What survival means here
This is the honest middle ground the framework exists to surface. The edge is statistically real and survives the kill-shot placebo and the deflated-Sharpe correction for multiple testing — the things that retire most strategies. What it does not yet have is a risk profile a small account can hold: a −49% drawdown will end most live deployments long before the trend pays off, and 43% of the P/L riding on one instrument is fragile.
The disciplined next step is a re-pre-registration with lower per-instrument risk and a broader basket, evaluated on a fresh window — not a post-hoc tweak to make this run pass. Survival earns a Round 2, not capital.
Verdict: SURVIVING (9/11). Real edge, wrong risk shape. The trend signal is genuine and placebo-confirmed; the −49% drawdown and 43% concentration must be re-scoped before this could clear all eleven gates and earn a paper allocation.
Equity curve
Growth of $84,783.836, cost-inclusive. Coded from the committed backtest series — not an image. Agents: GET /api/v1/strategy/TRT/equity
Charts & evidence
Frequently asked
Does the Turtle trading system still work in 2026?
The signal still carries a real edge. Run over 2014–2026 through a pre-registered 11-gate battery, the Turtle / Donchian-channel breakout system posts a profit factor of 1.61, a Sharpe of 0.90, and a deflated Sharpe of 0.997, and it beats a random-breakout placebo. It passes 9 of 11 gates — the two failures are a −49% max drawdown (the classic trend-following deep-drawdown profile) and 43% profit concentration in one instrument. It is a survivor under evaluation, not yet a deployment-cleared strategy.
Why is the Turtle system not marked Validated despite passing 9 of 11 gates?
Because two of the gates it fails are real risk constraints, not technicalities. A −49% max drawdown exceeds the 12% gate by a wide margin, and 43% of profit comes from a single instrument (the 40% concentration limit). The trend edge is statistically genuine — placebo-confirmed, deflated-Sharpe positive — but the risk profile needs to be re-scoped (lower per-instrument risk, broader basket) before it could clear all eleven and earn capital.
Methodology: 11-gate validation — pre-registered spec, 11-gate battery, real market data. Full reproducible report: backtests/turtle/results.json in the source repository.Author: Validated Research Team (Methodology v1.0 — 11-gate validation). Backtests are not investment advice.